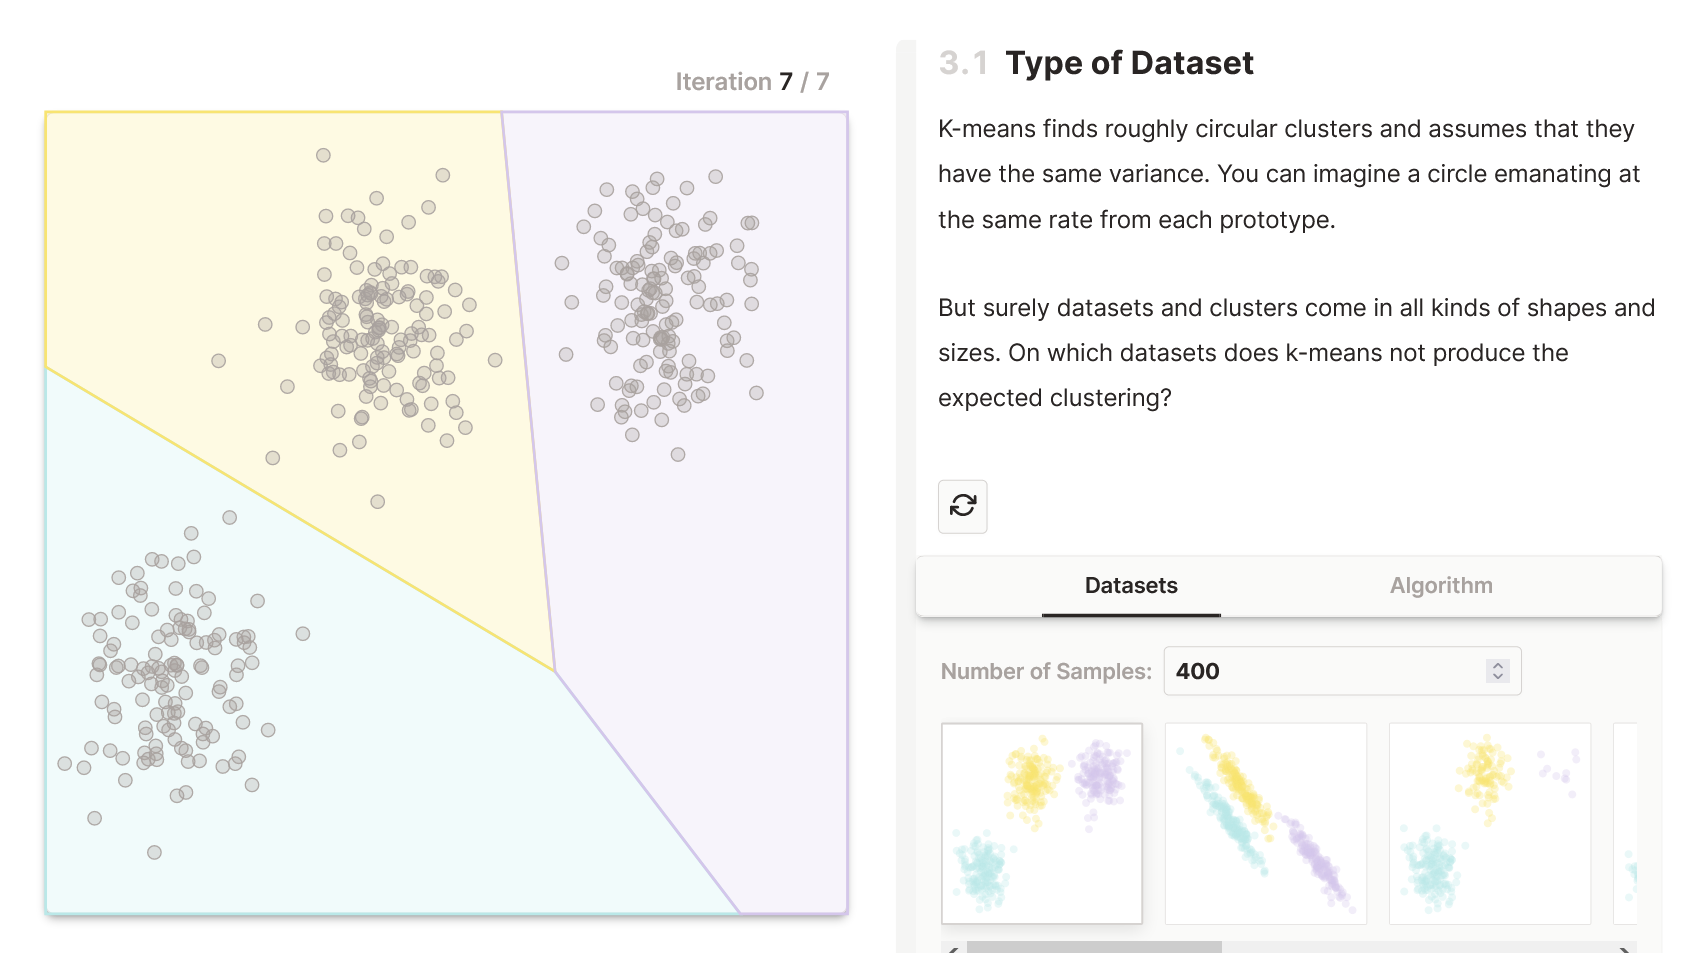
VoM #7 – An Explorable Explainer
reviewed by Jane Momme
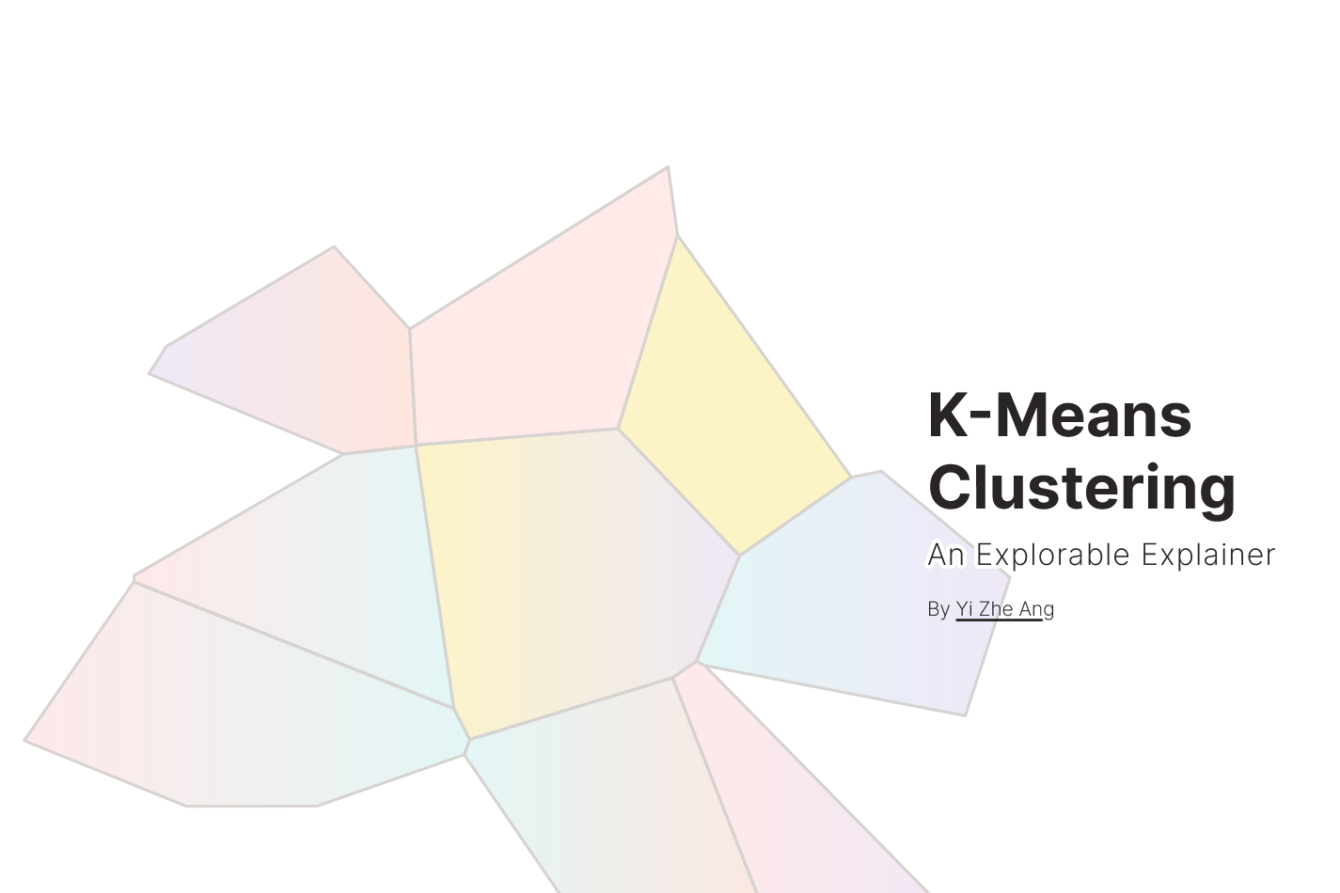
K-Means Clustering
An Explorable Explainer by Yi Zhe Ang
Most theoretical descriptions struggle to bring mathematical procedures to life within one’s own imagination. However, Yi Zhe Ang’s translation of the K-Means algorithm into an explorable explainer does just that: it breathes life into an abstract logical concept. With his visualization, he invites users to derive variation themselves. That is why we have chosen K-Means Clustering. An Explorable Explainer by Yi Zhe Ang as our Visualization of the Month #7.
Tracking Down Scientific Data
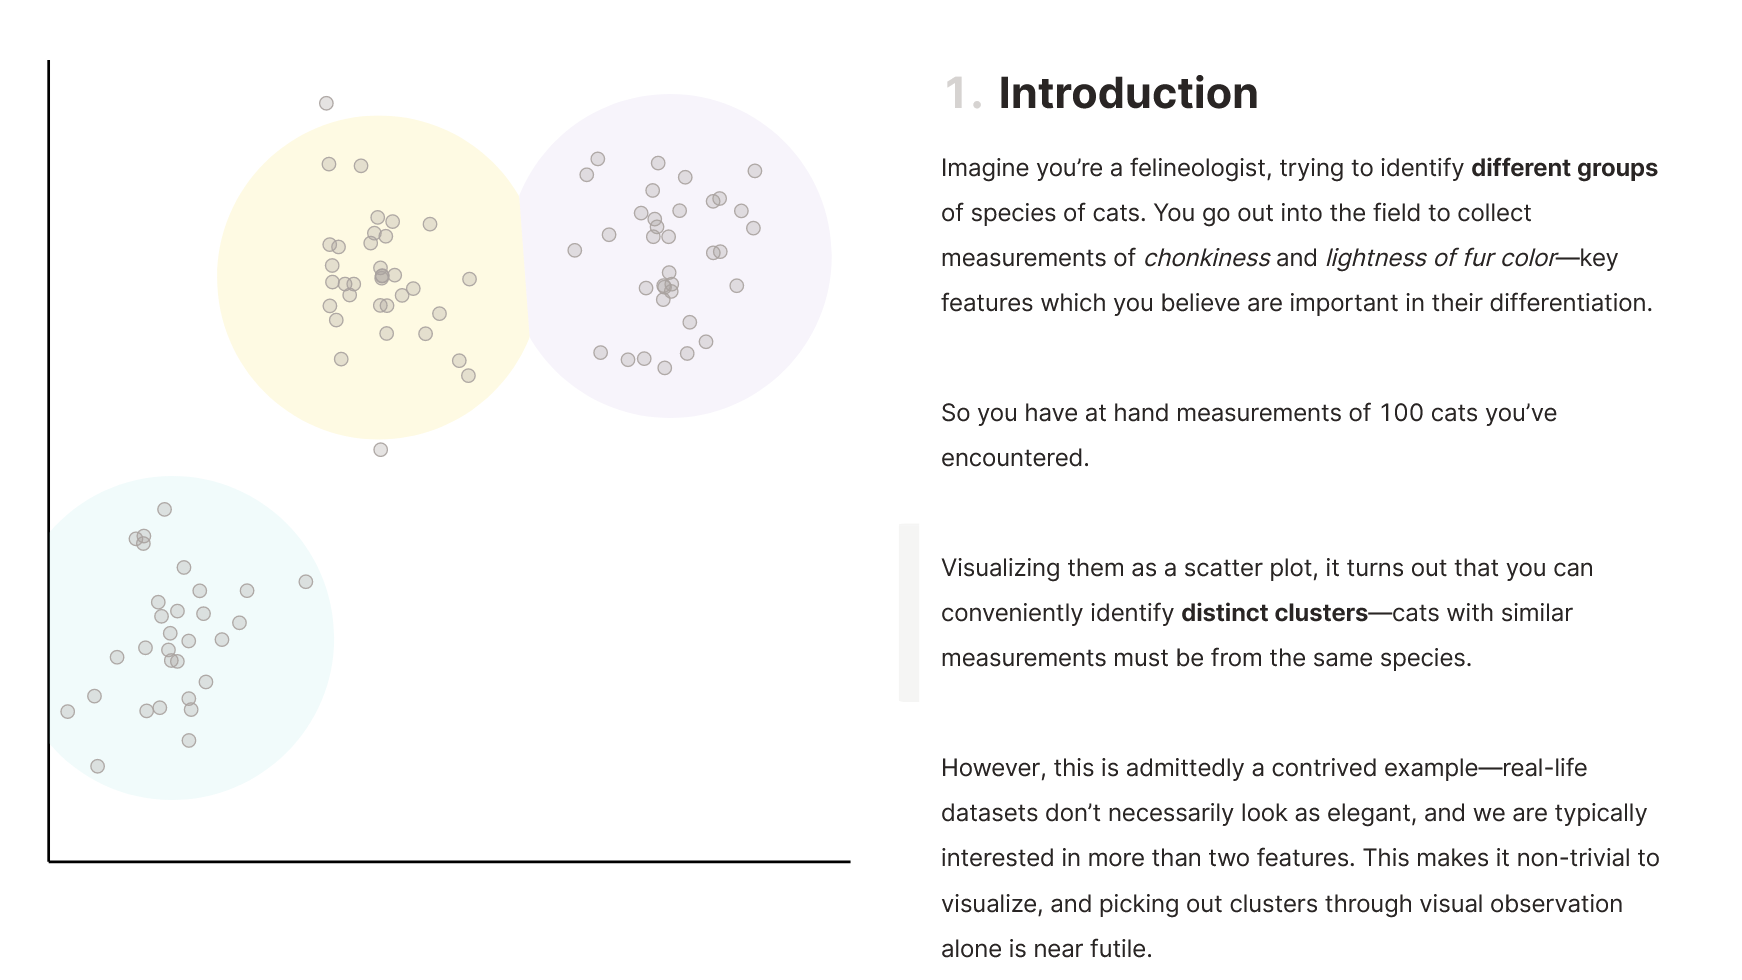
In the search for hidden structures in their data, scientists sometimes use a method known as clustering. This involves identifying groups in a data set that belong together and can be clearly distinguished from other groups on the basis of certain characteristics. As a rule, clustering is based on the greatest possible equality within the same group and the greatest possible differences between different groups. Clustering is used in a wide variety of disciplines, from machine learning to psychological market research.
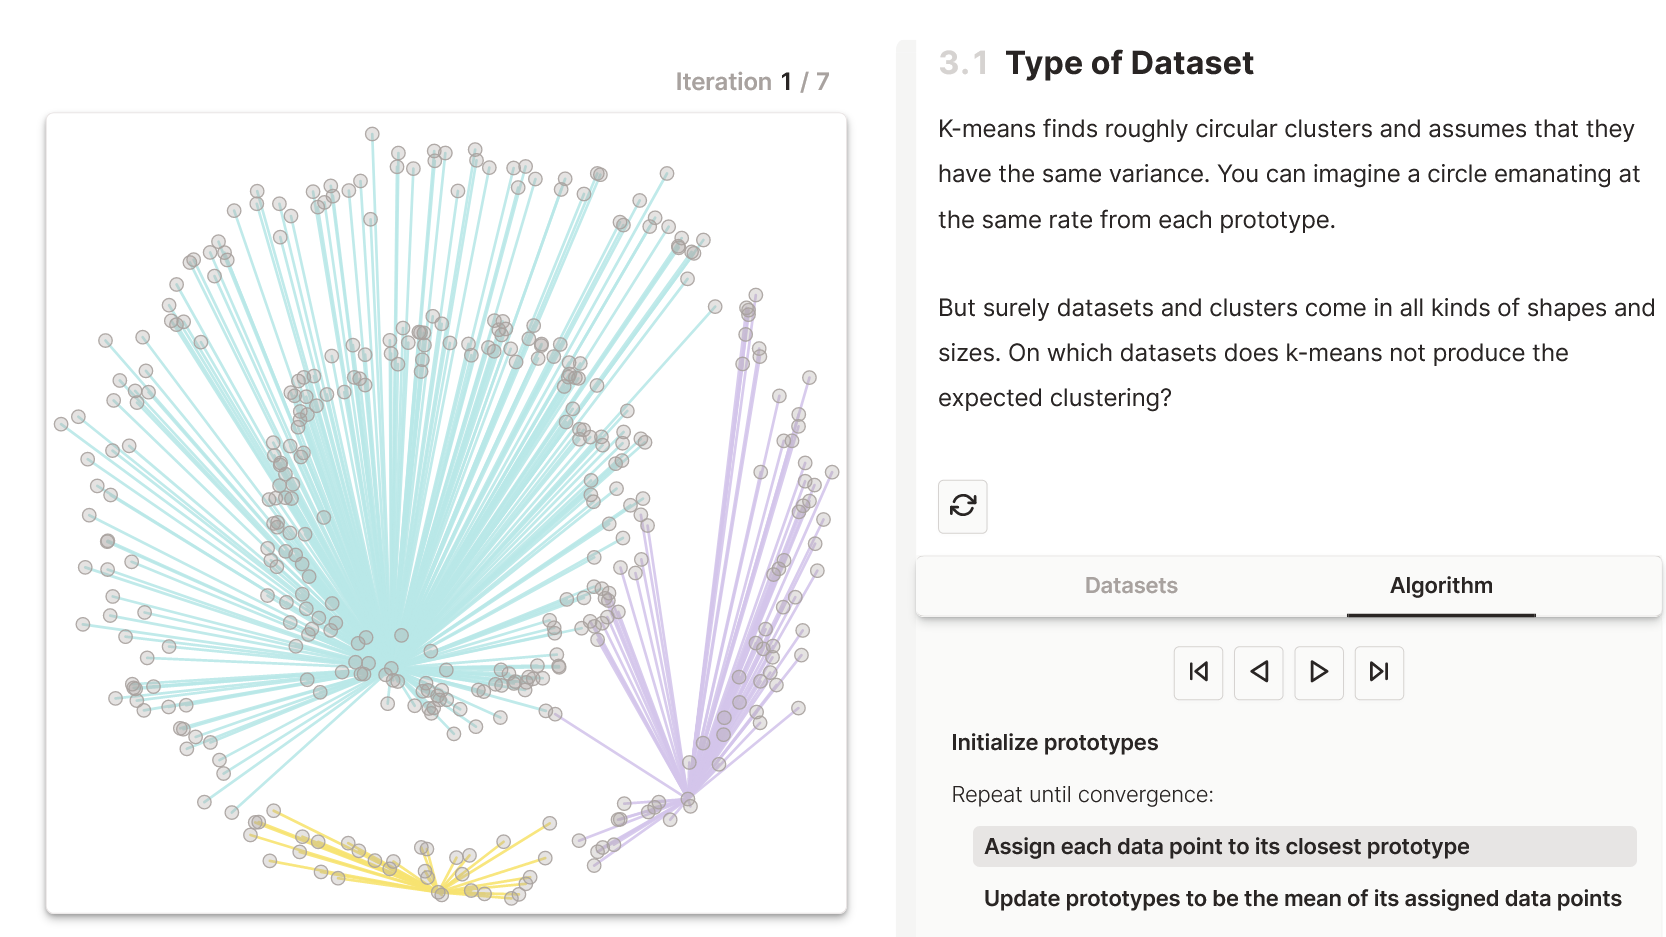
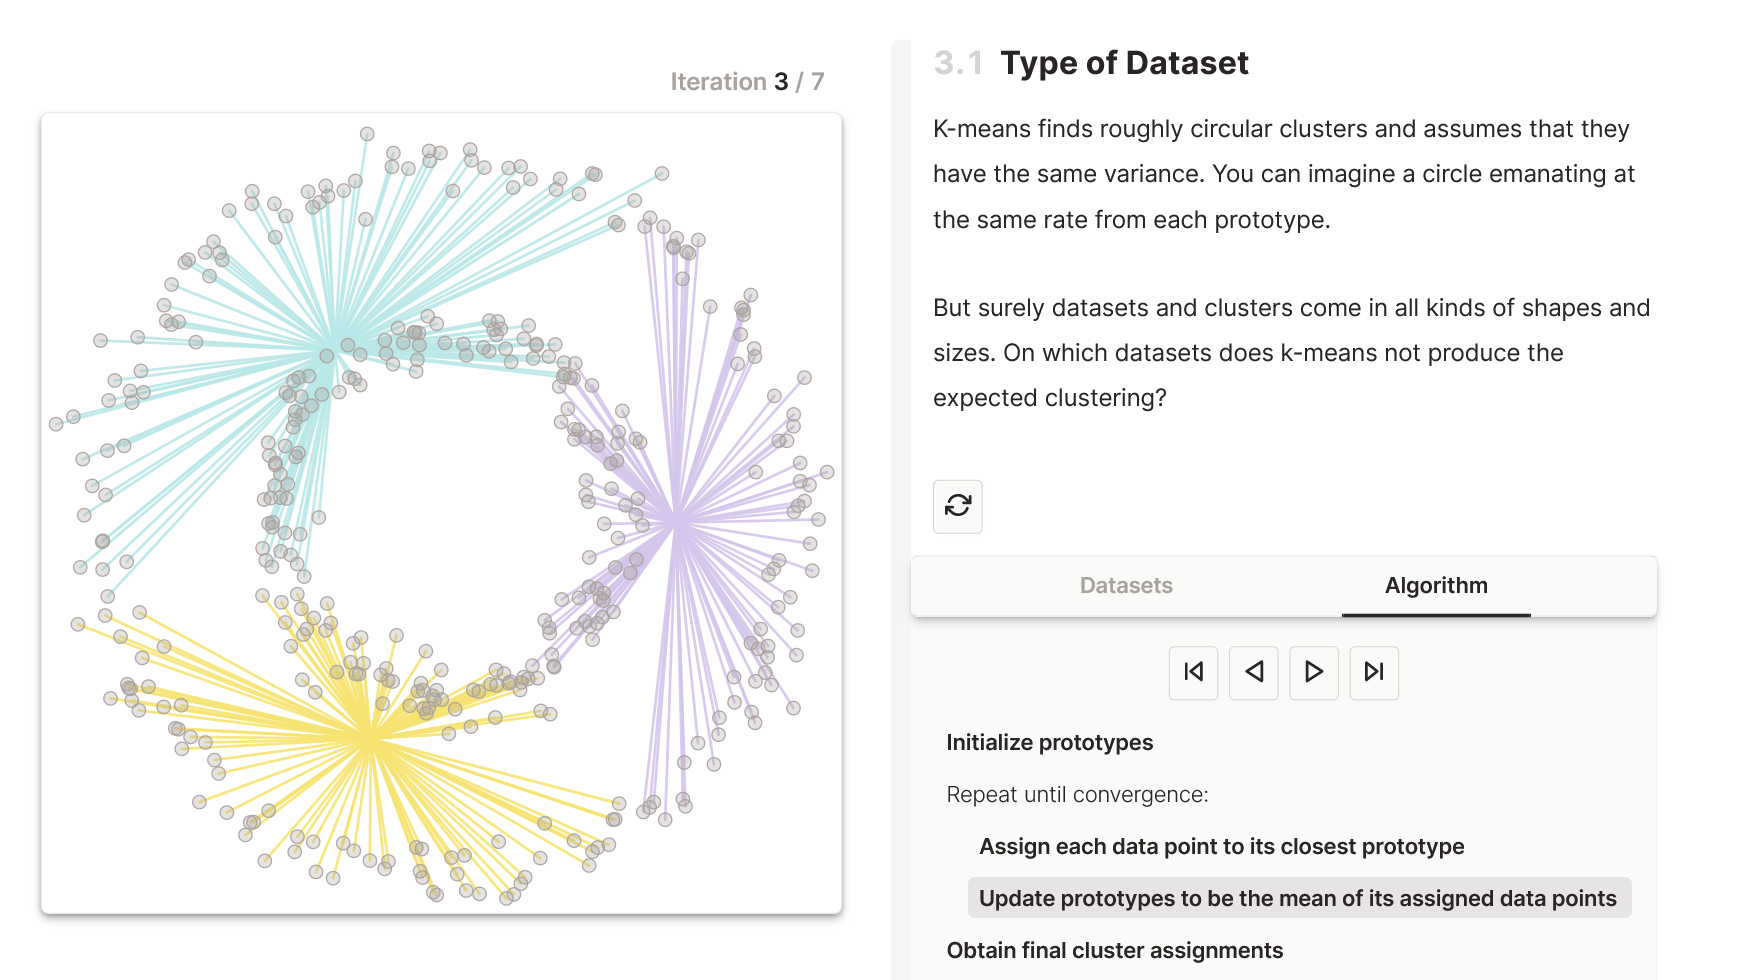
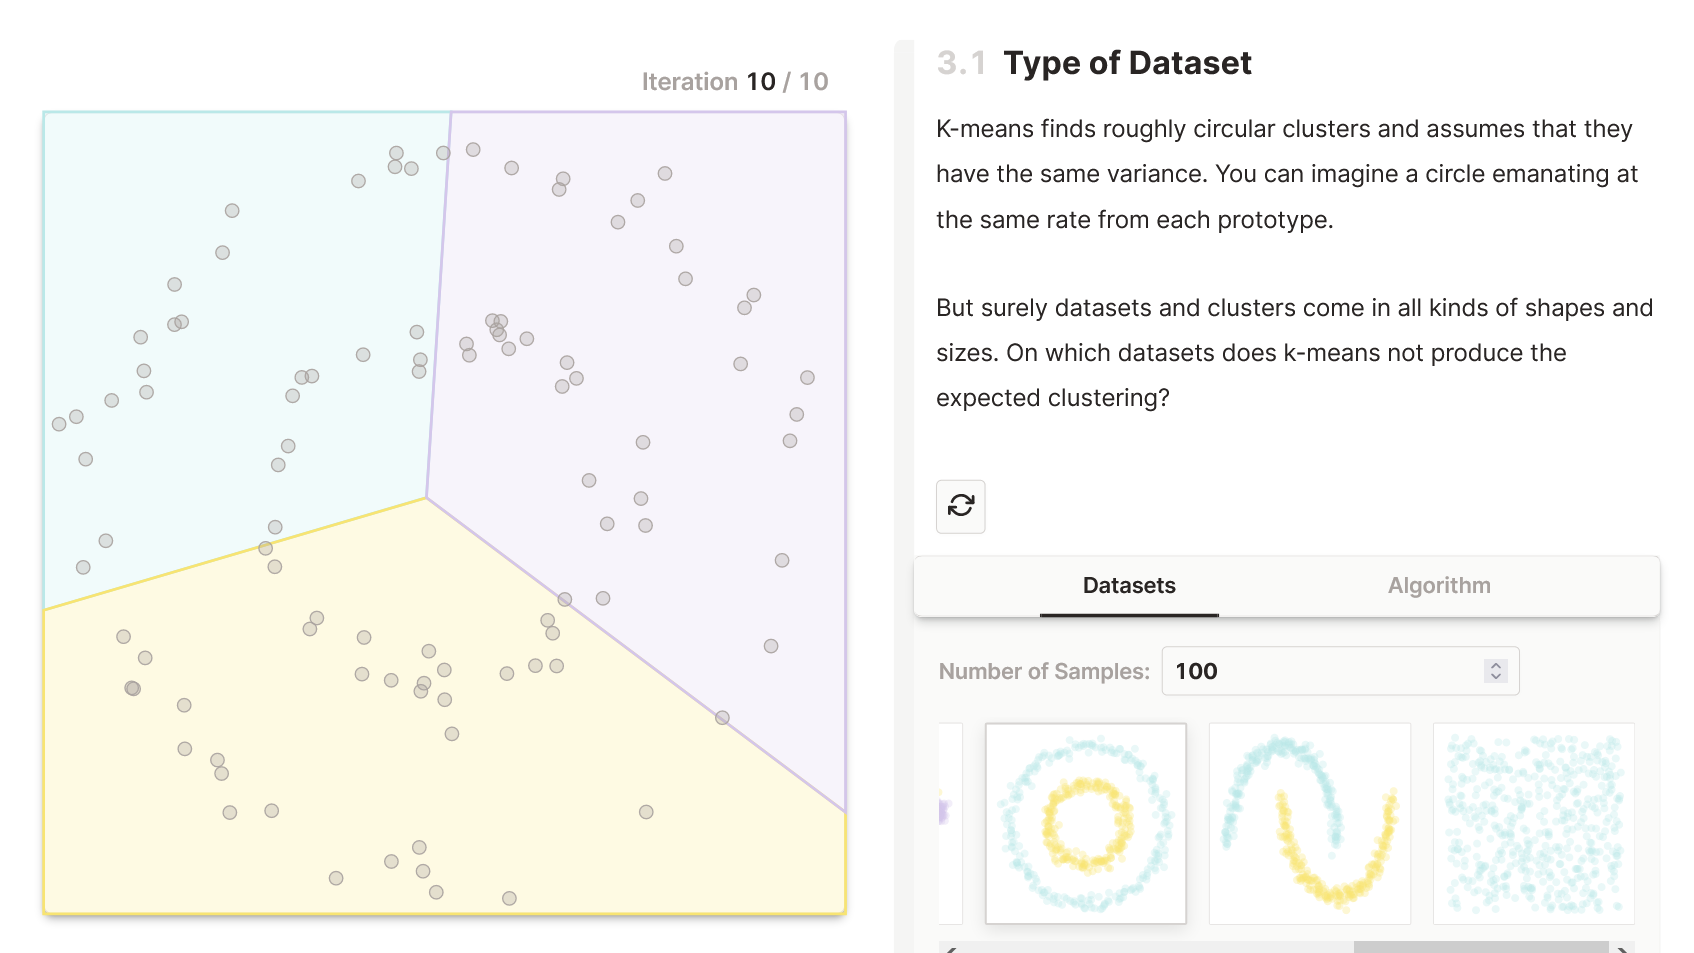
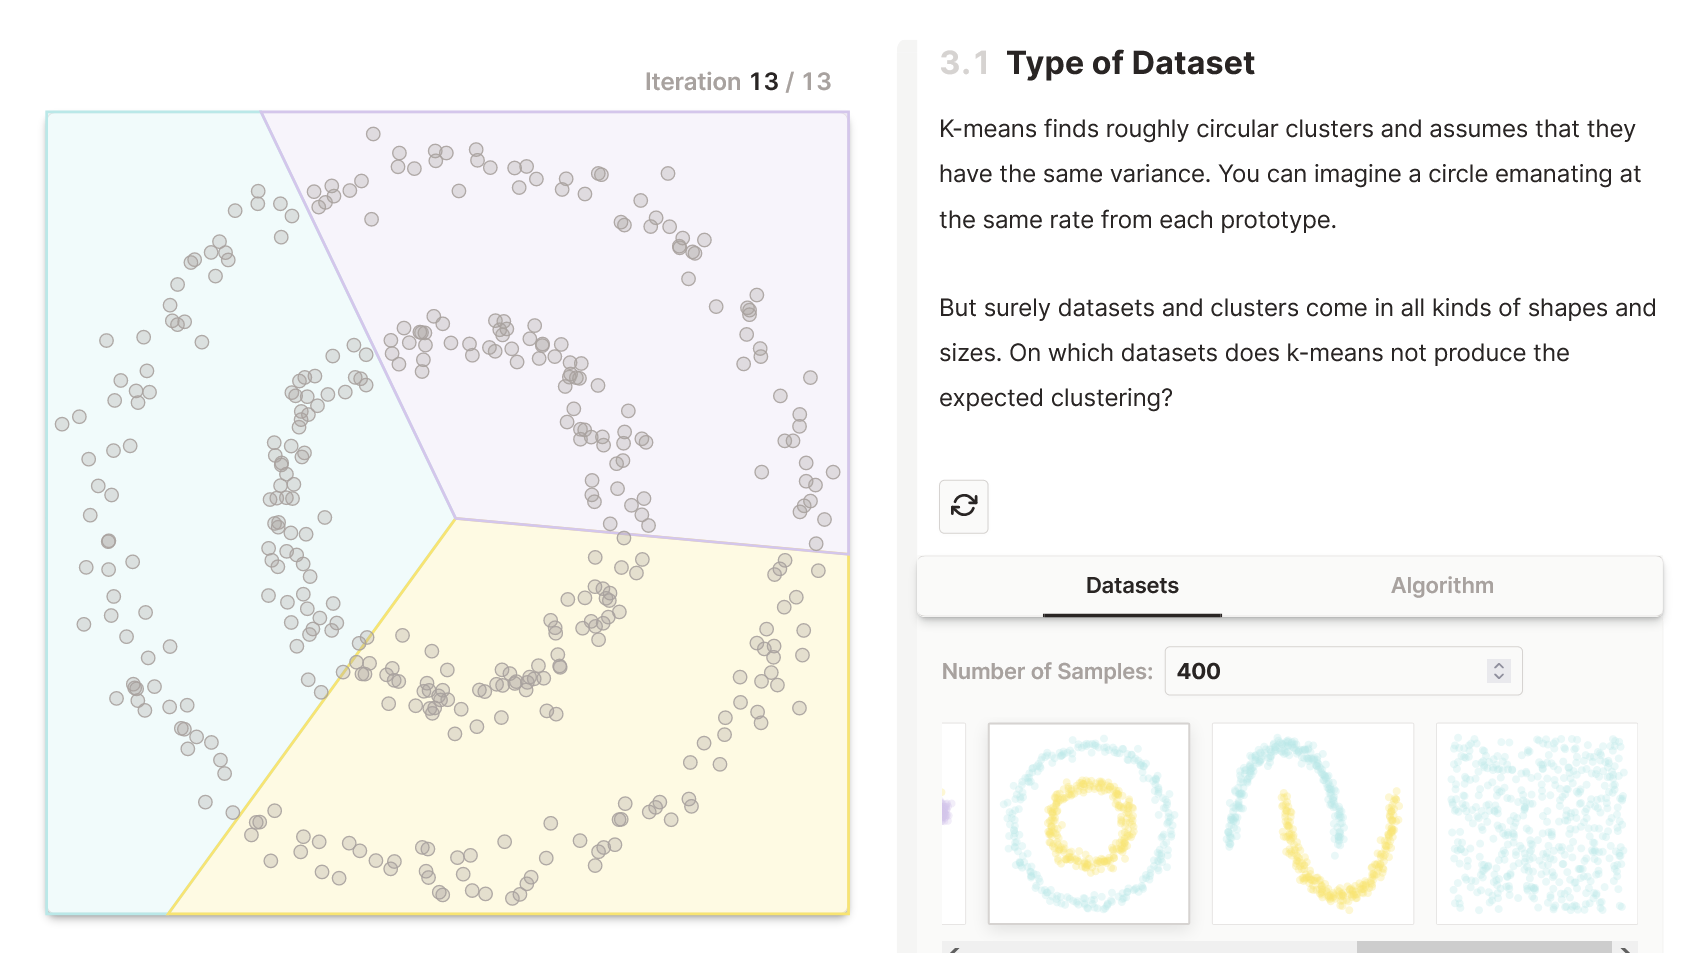
The K-Means Algorithm
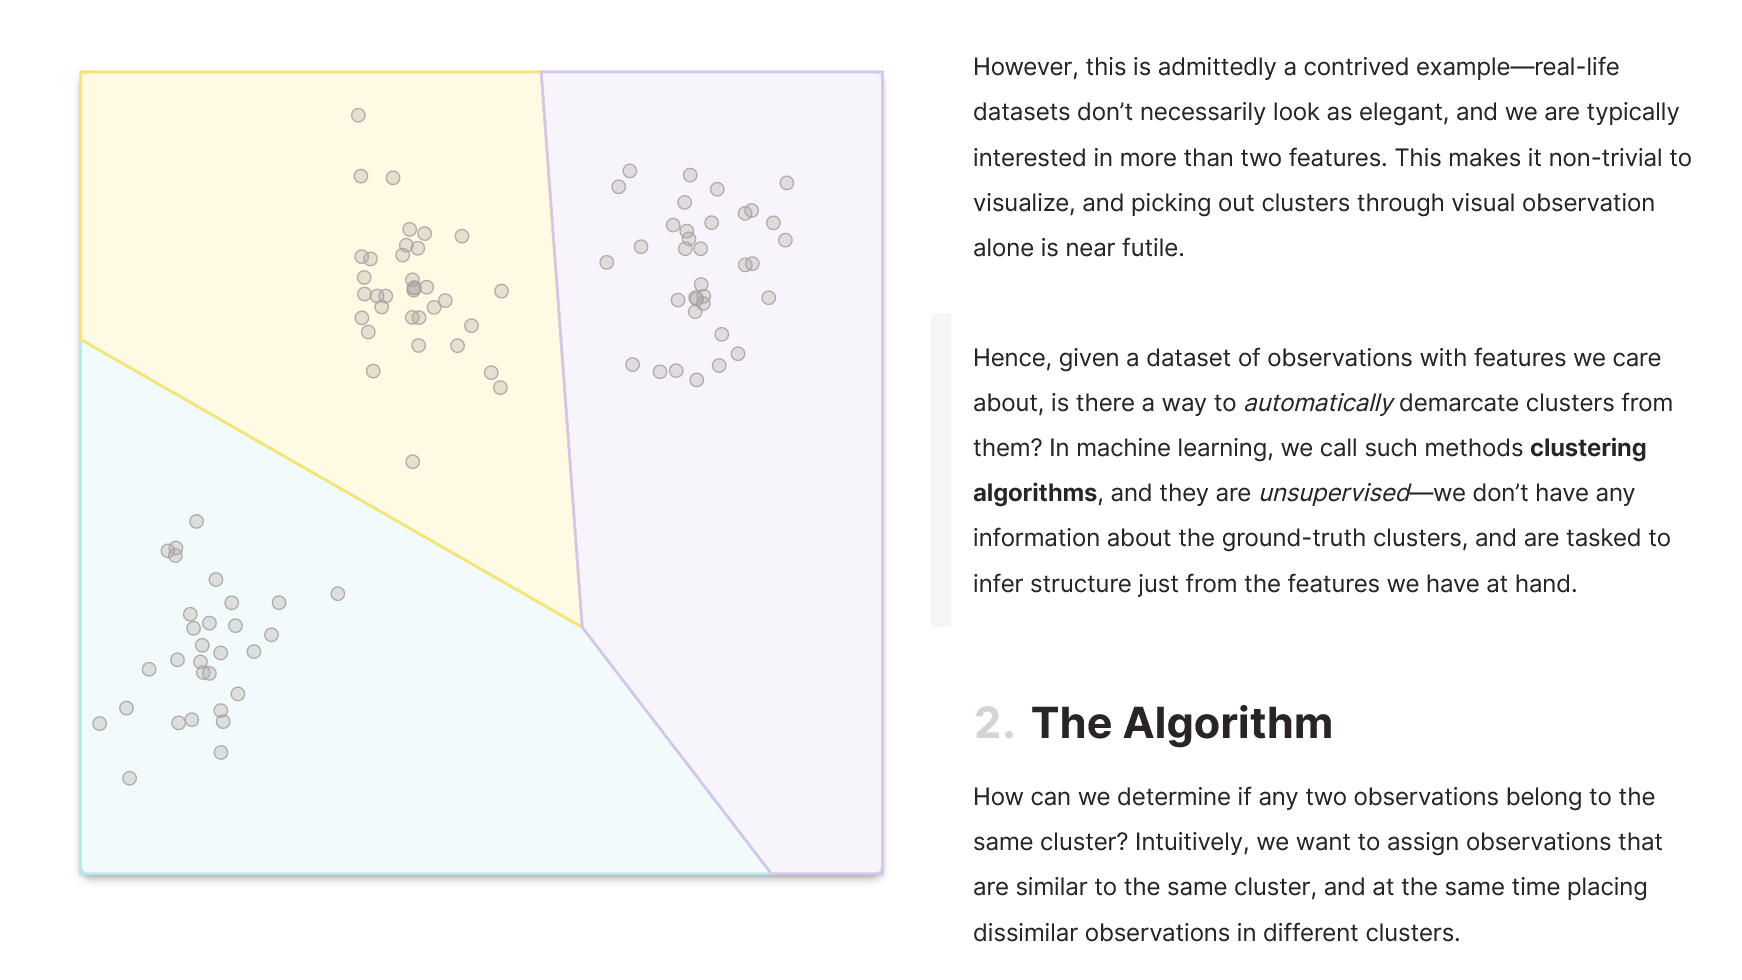
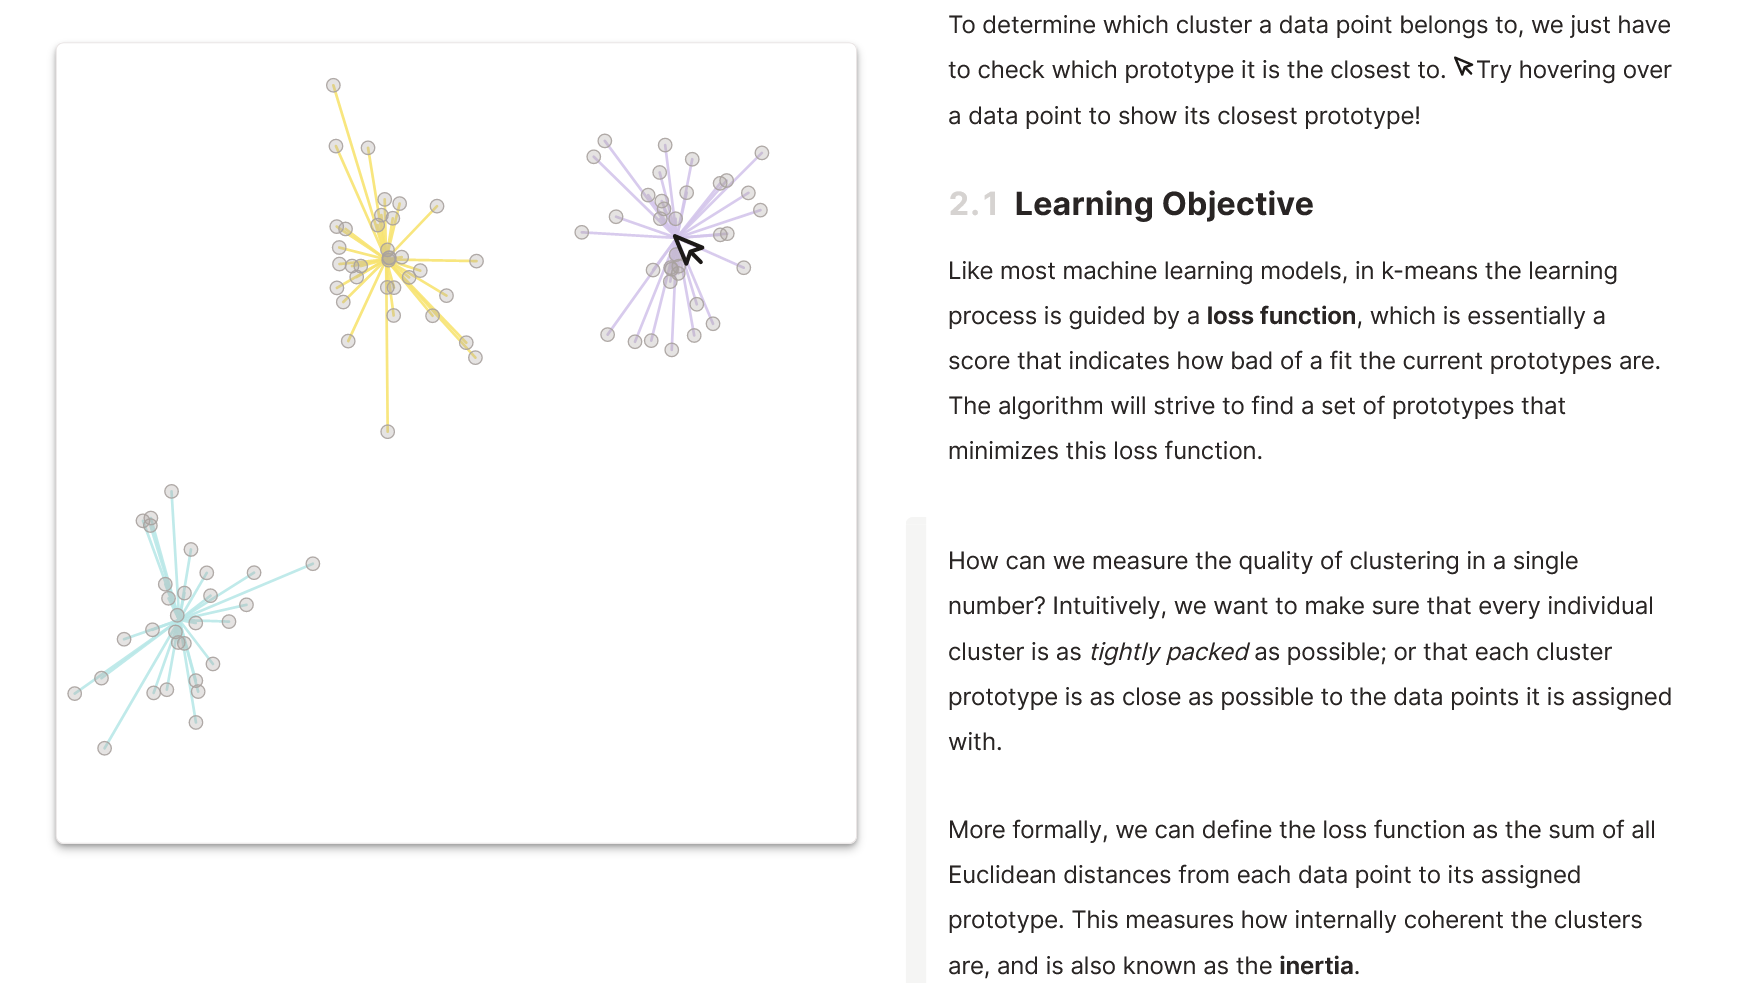
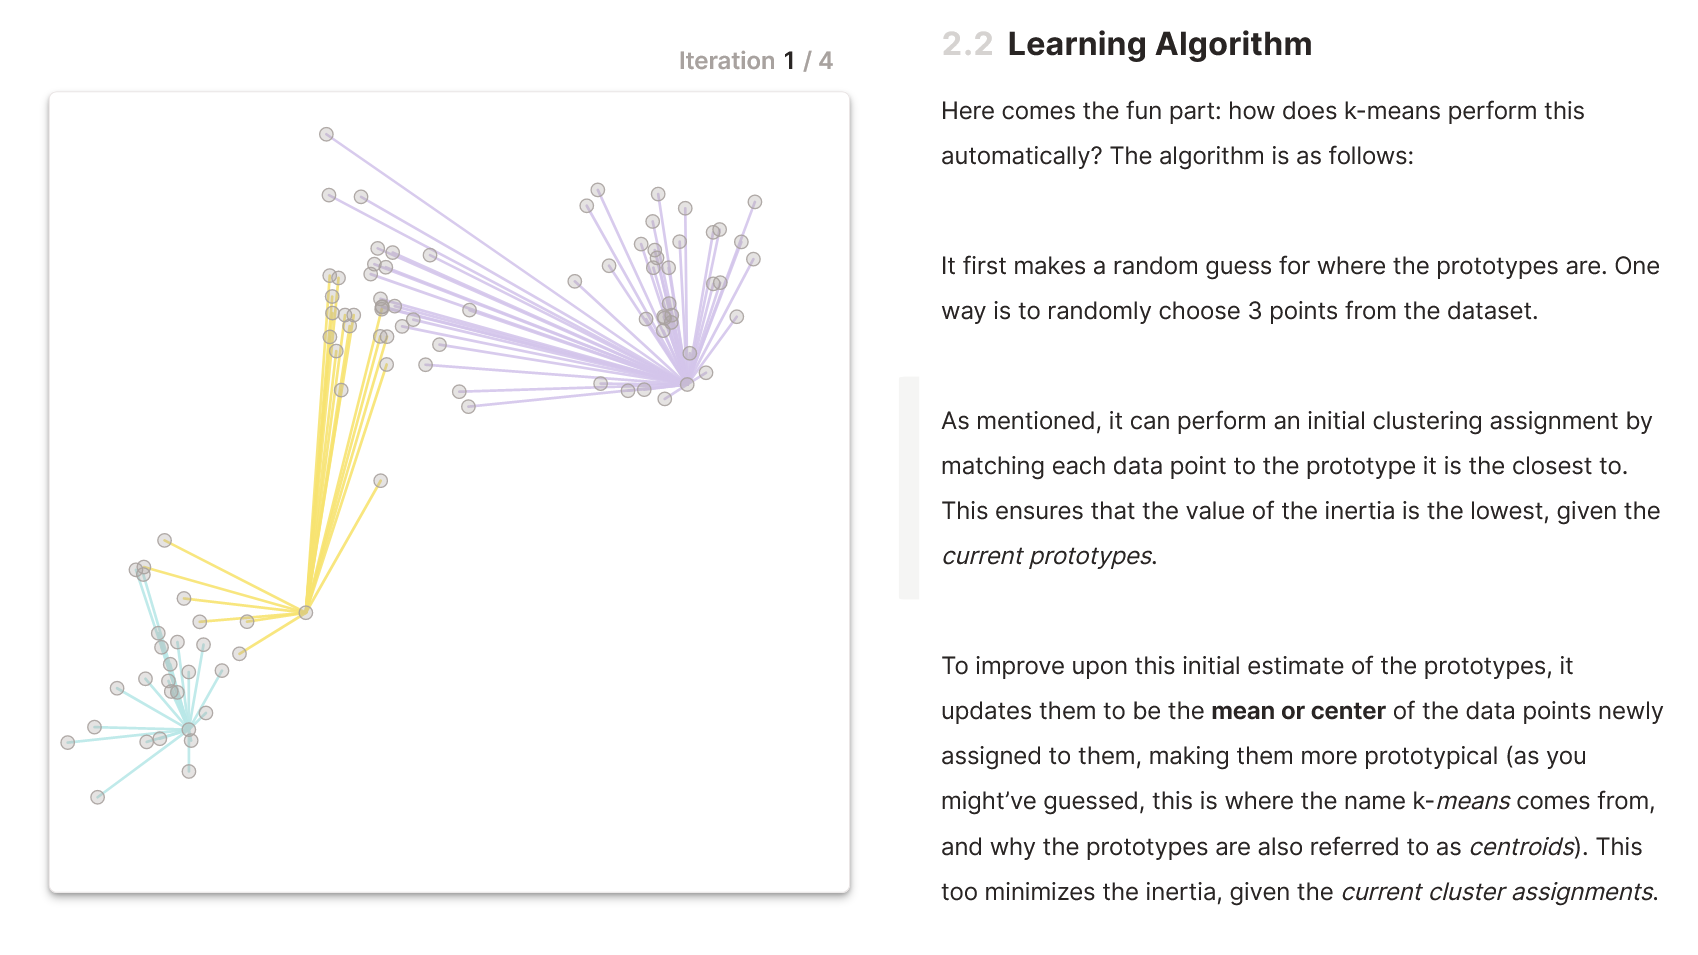
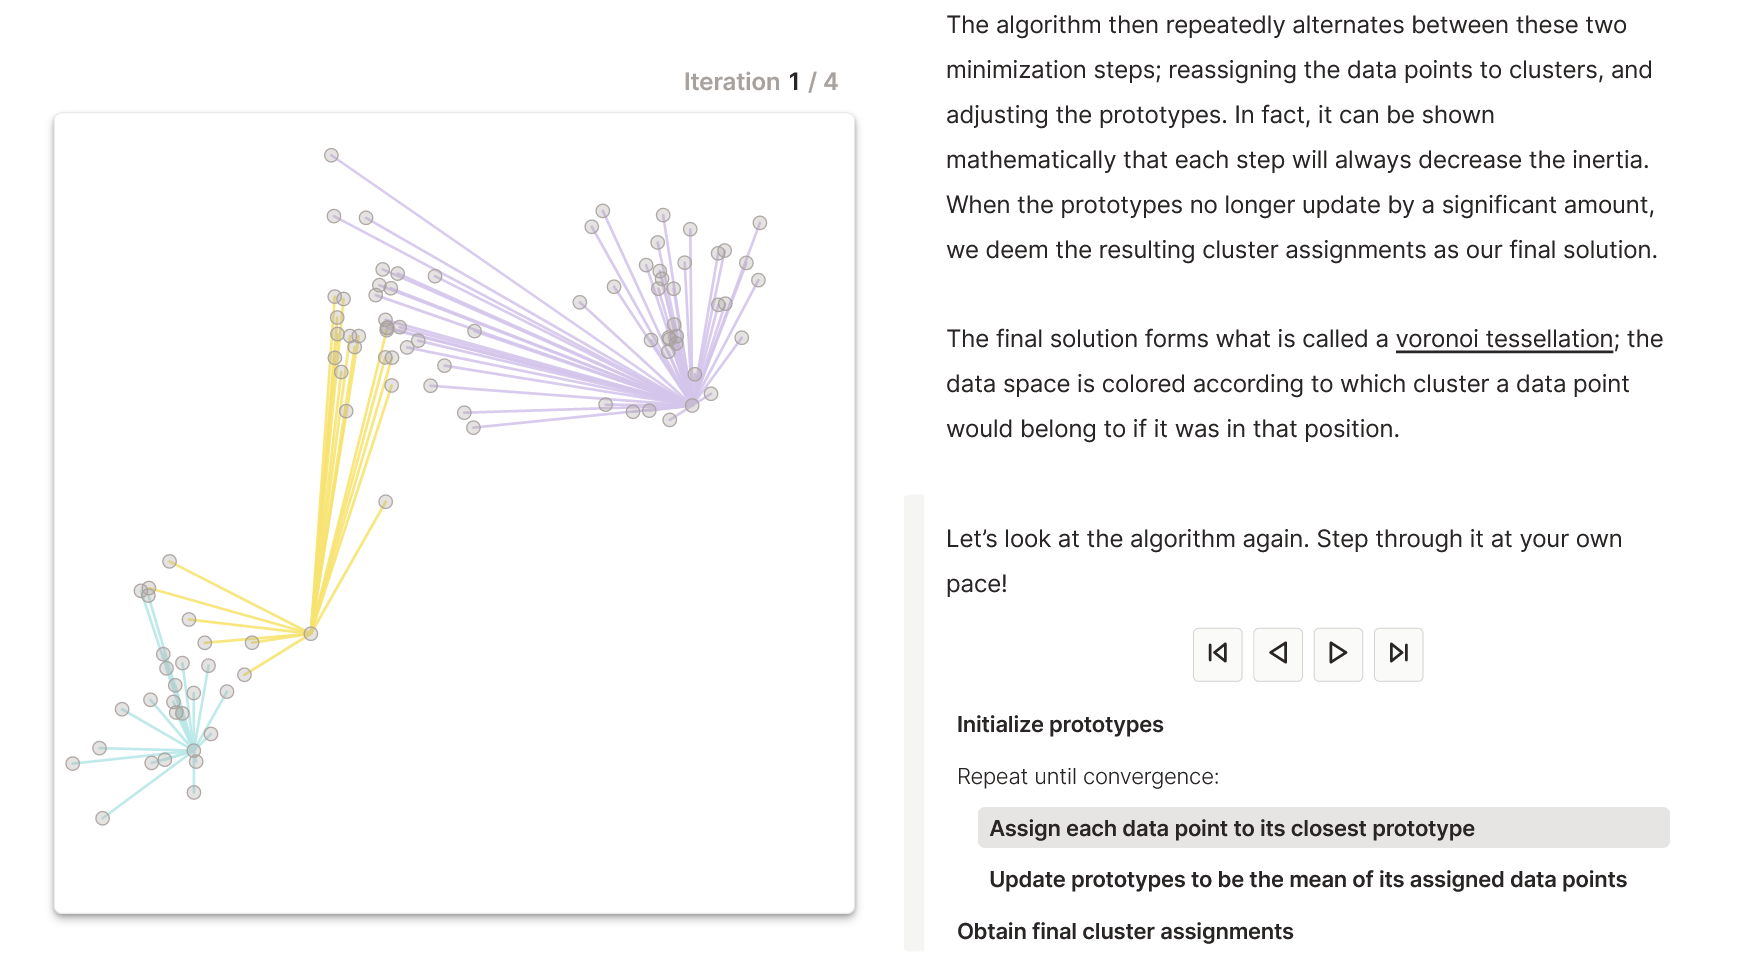
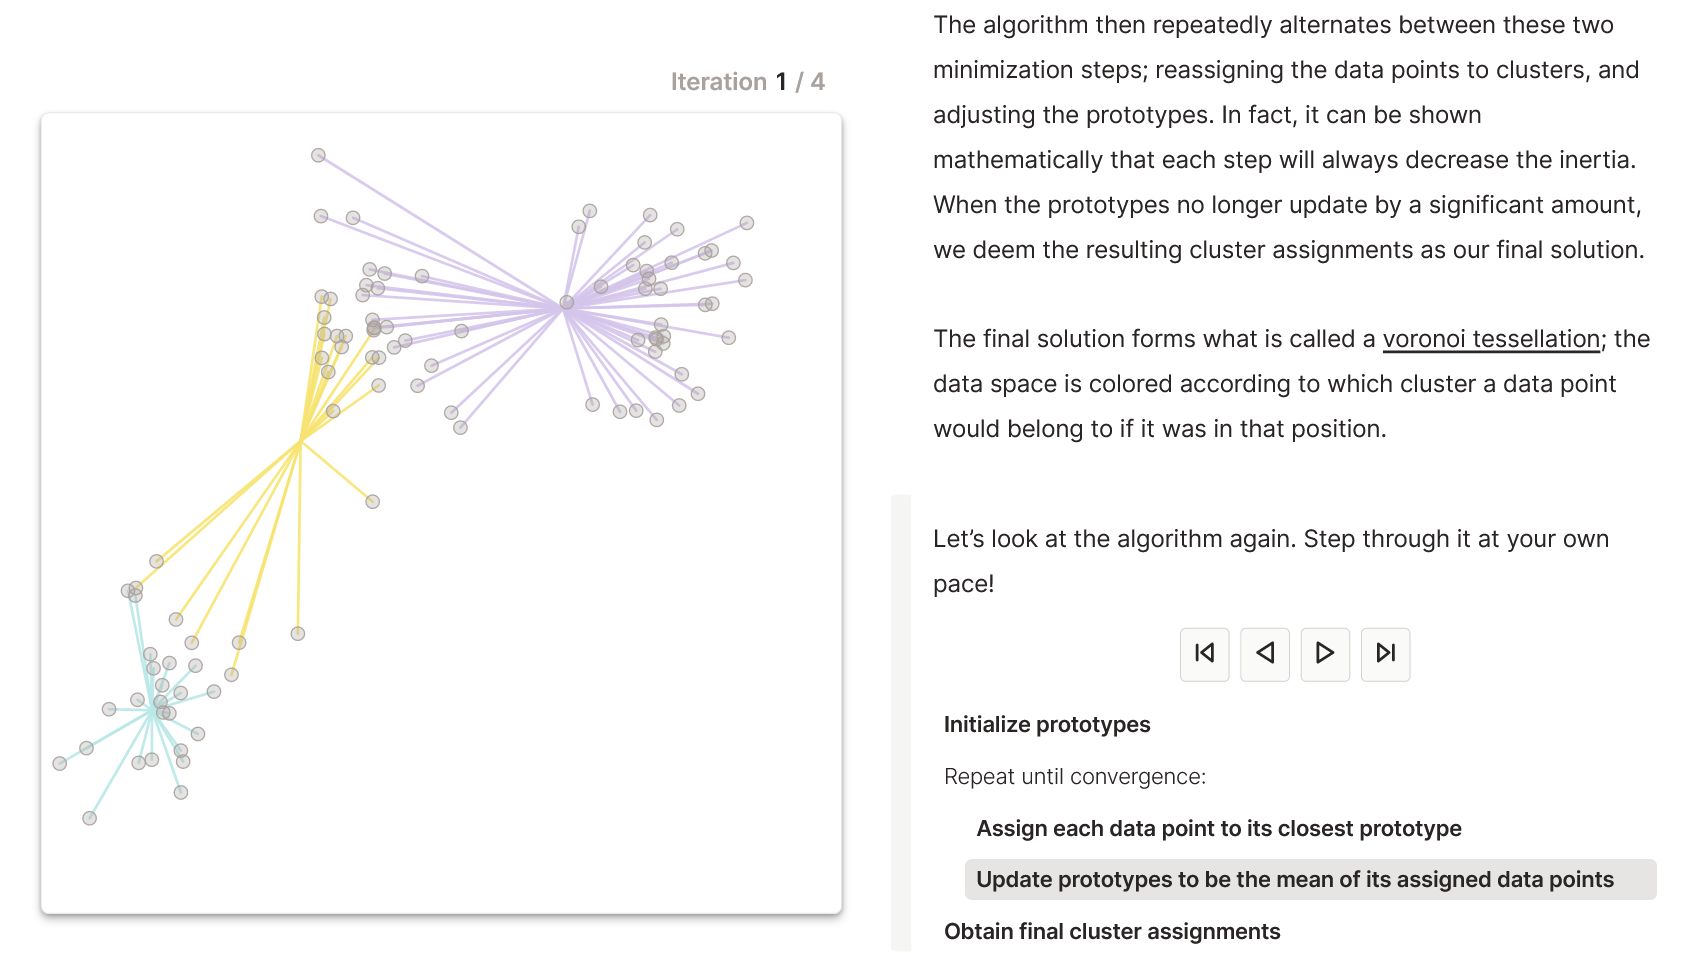
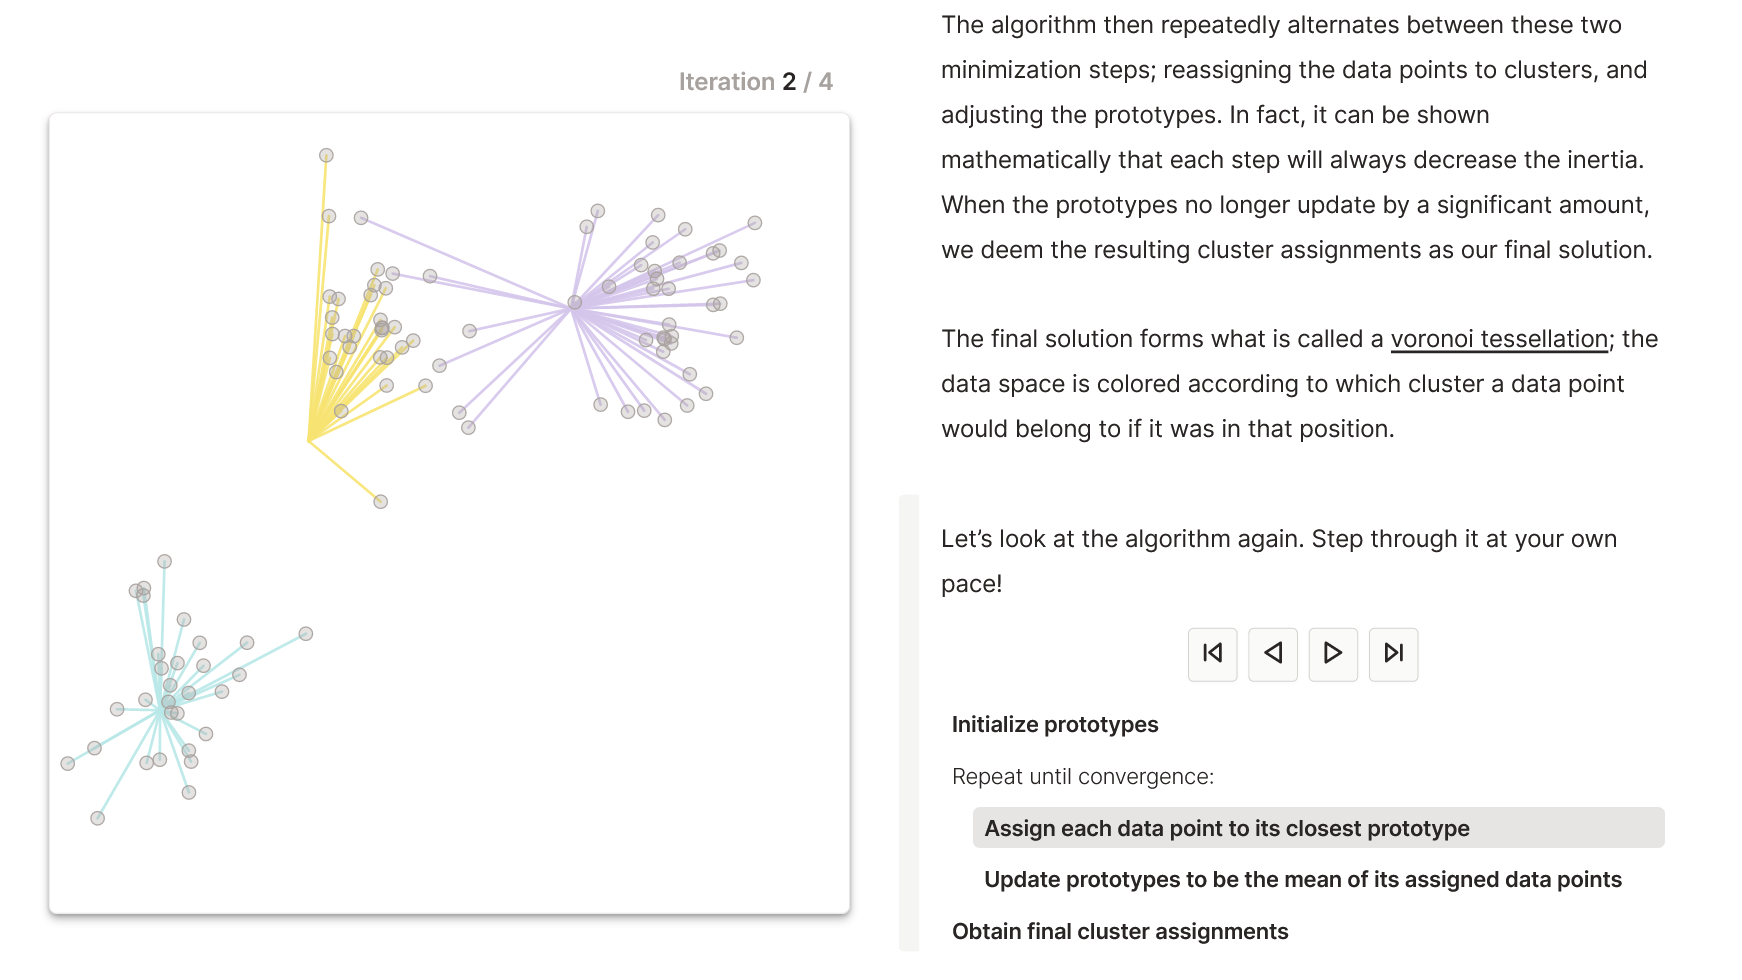
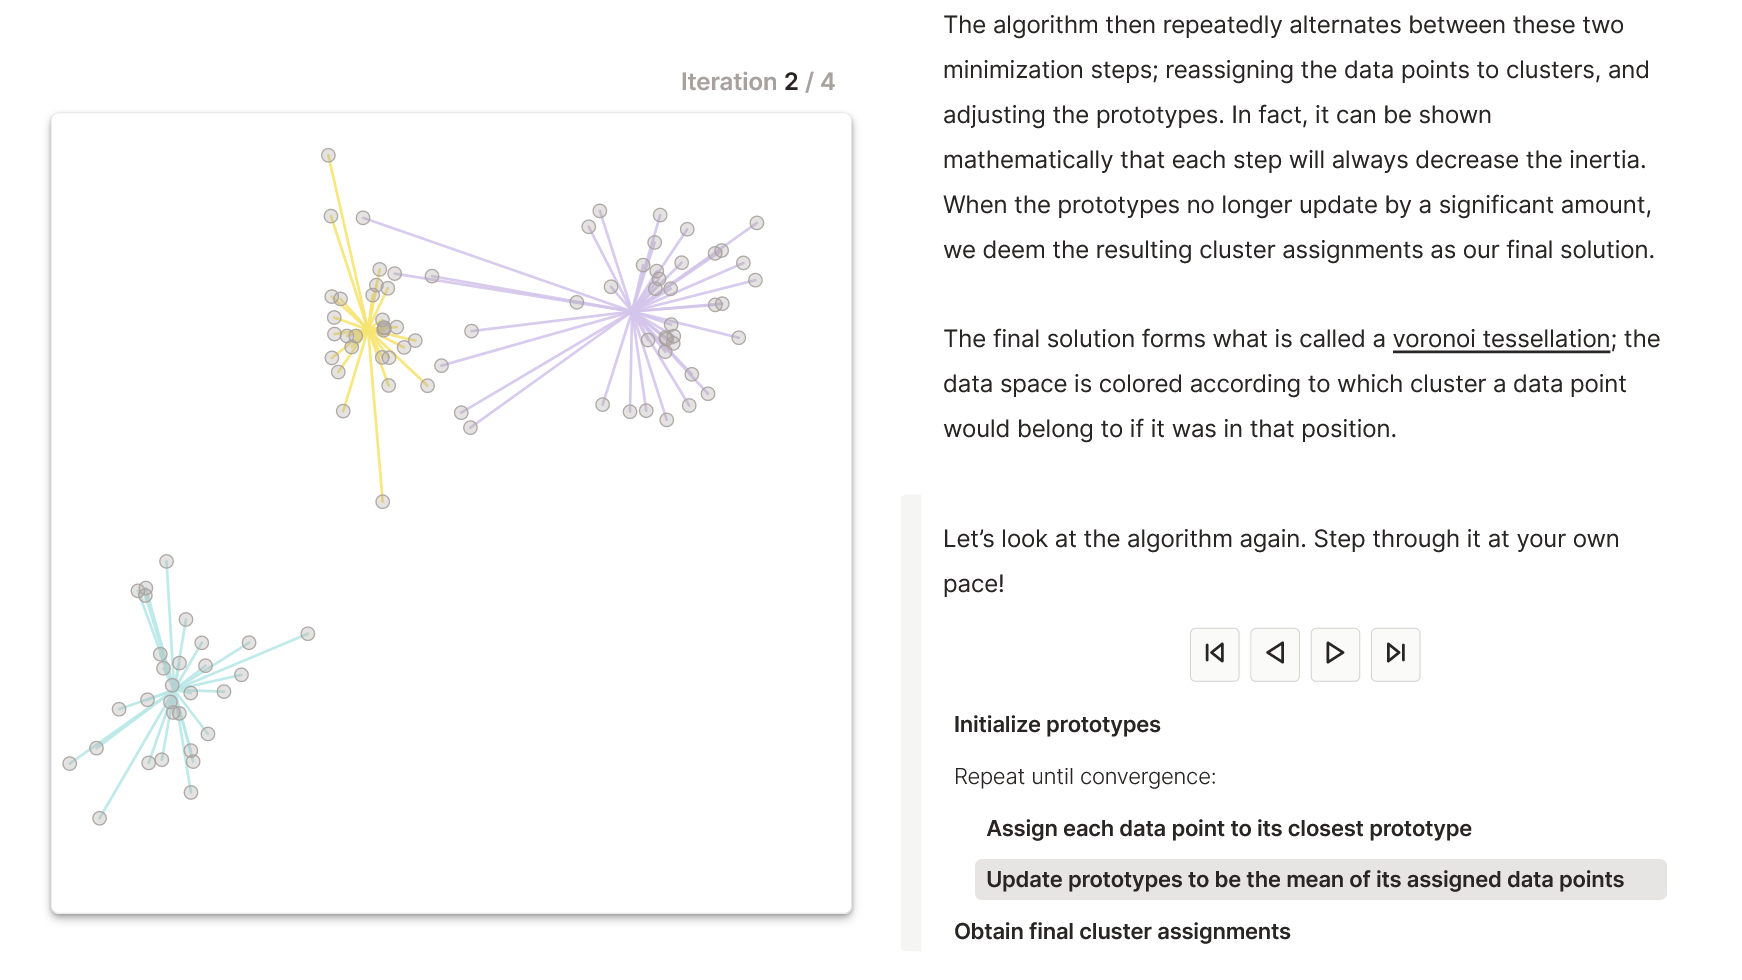
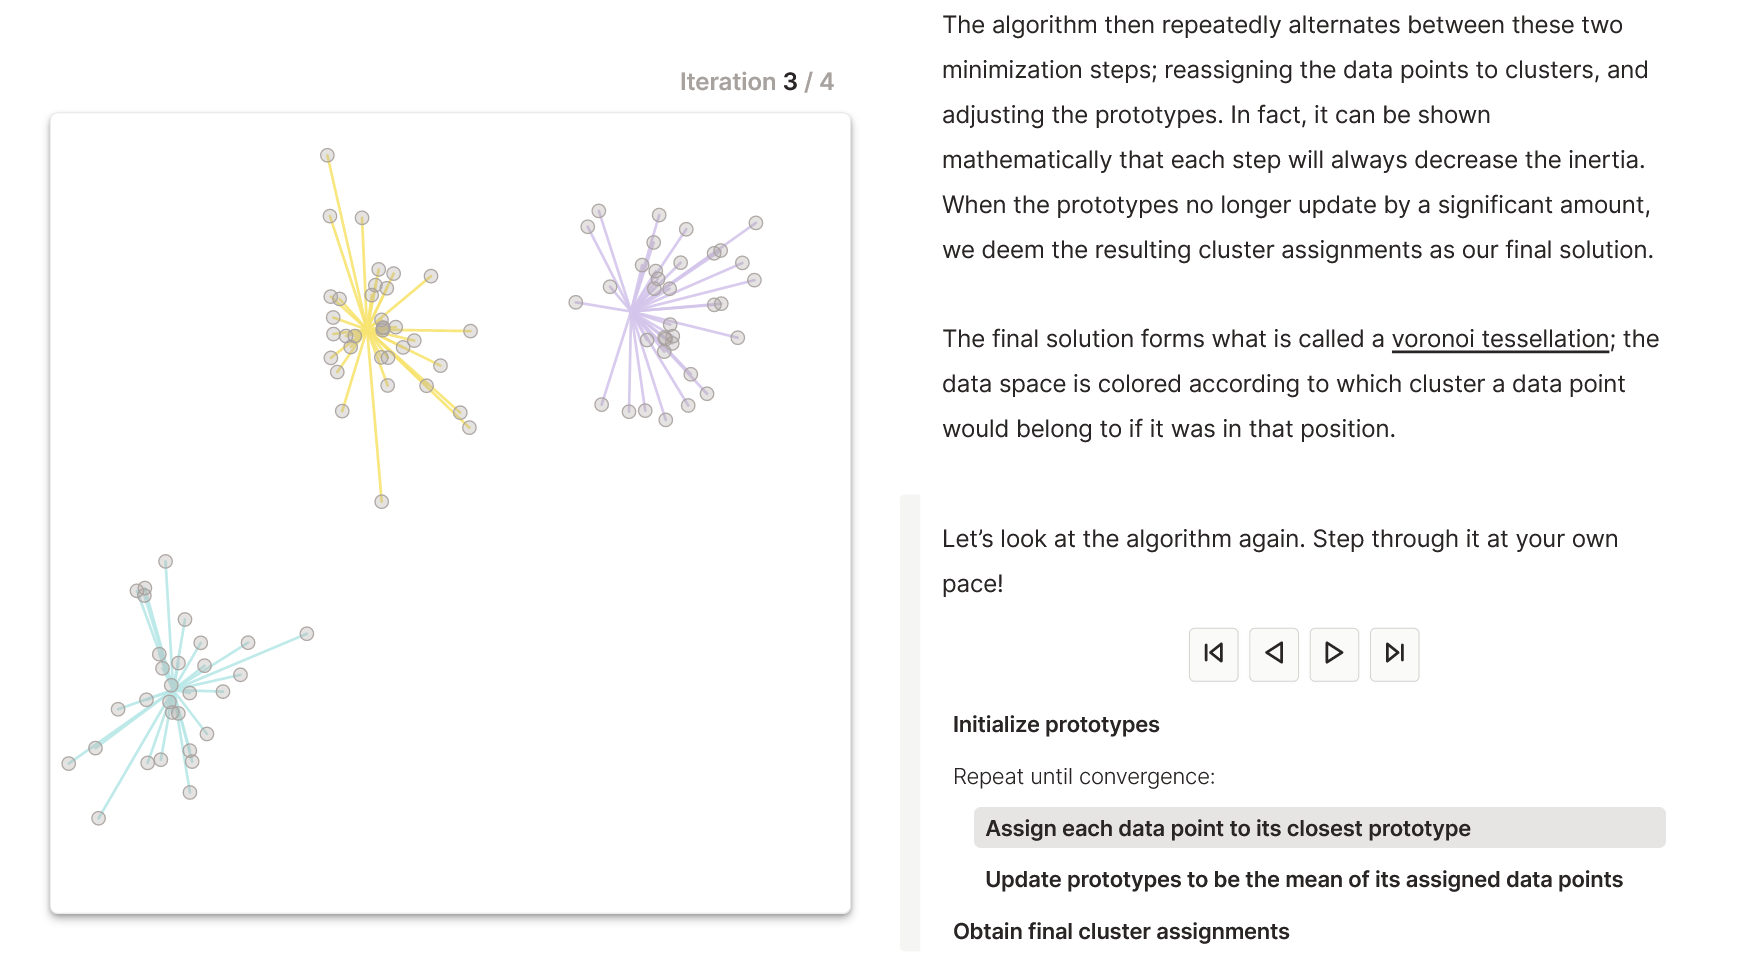
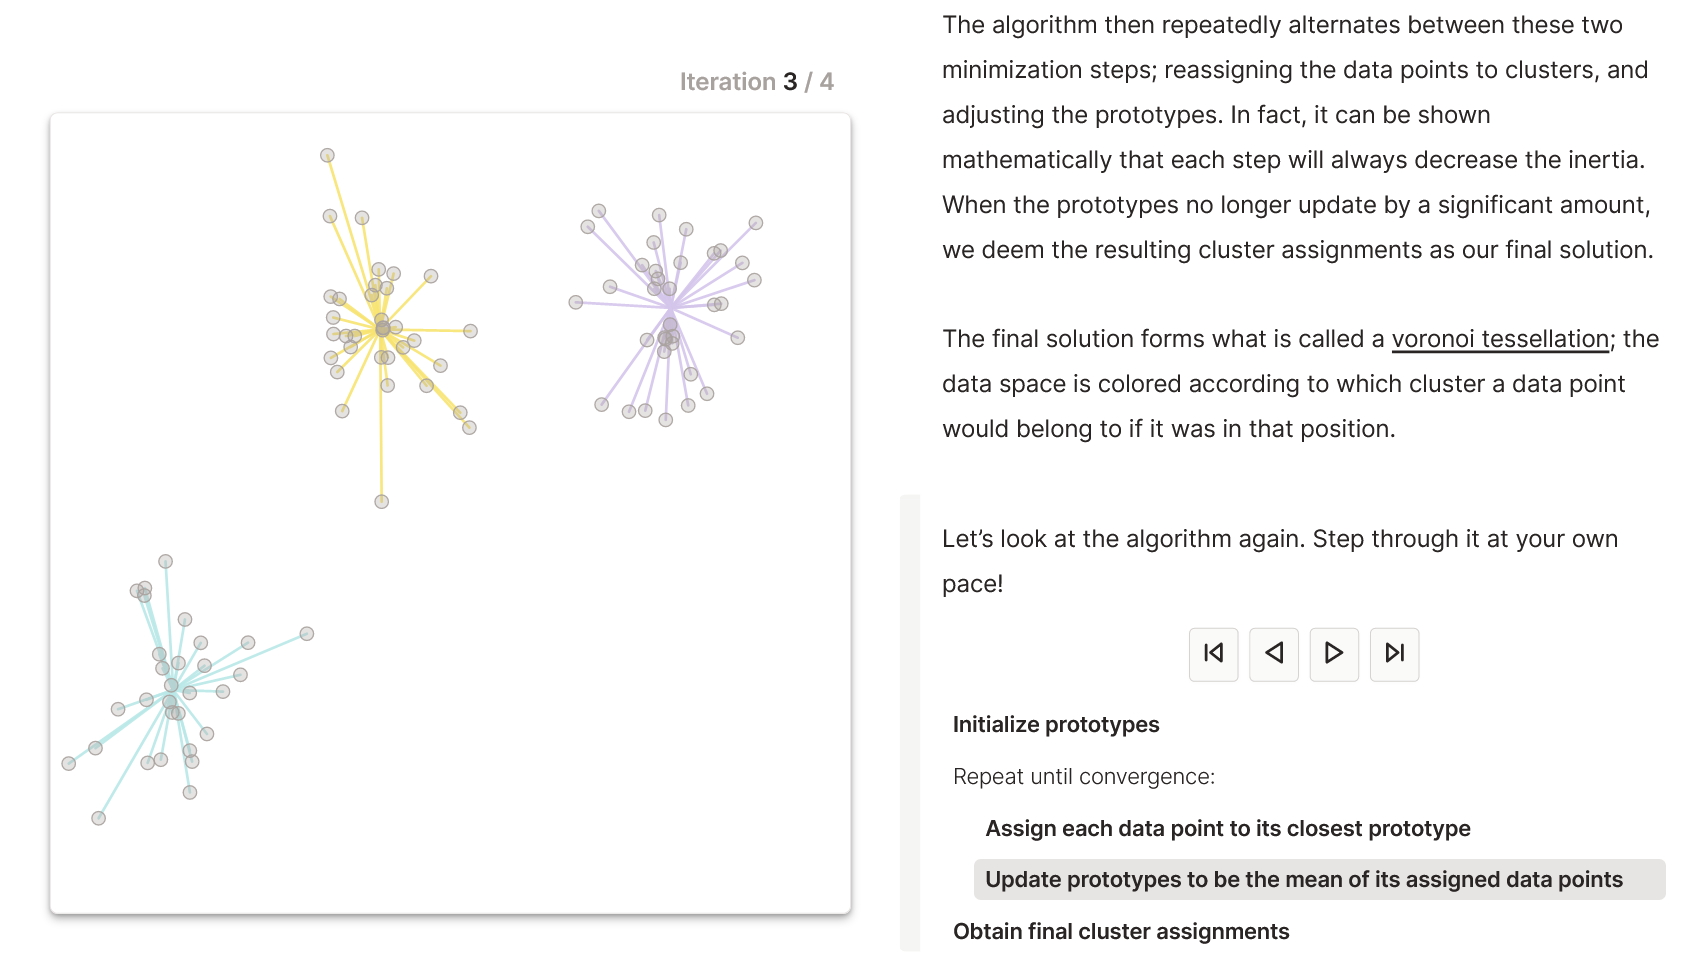
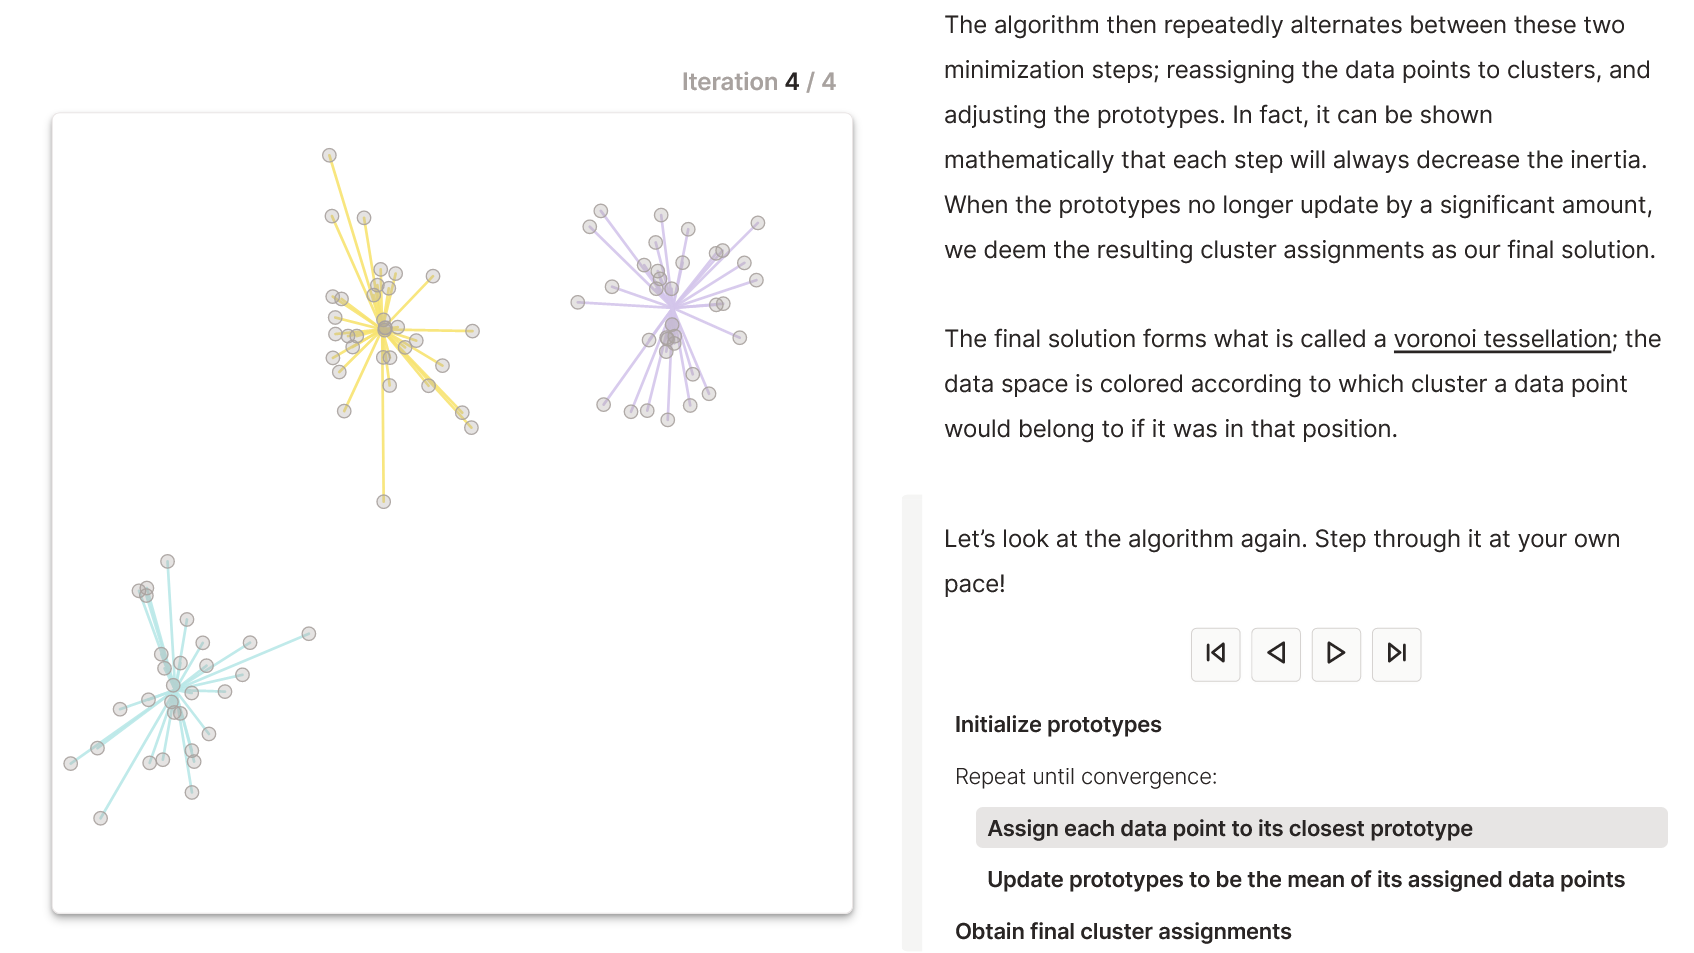
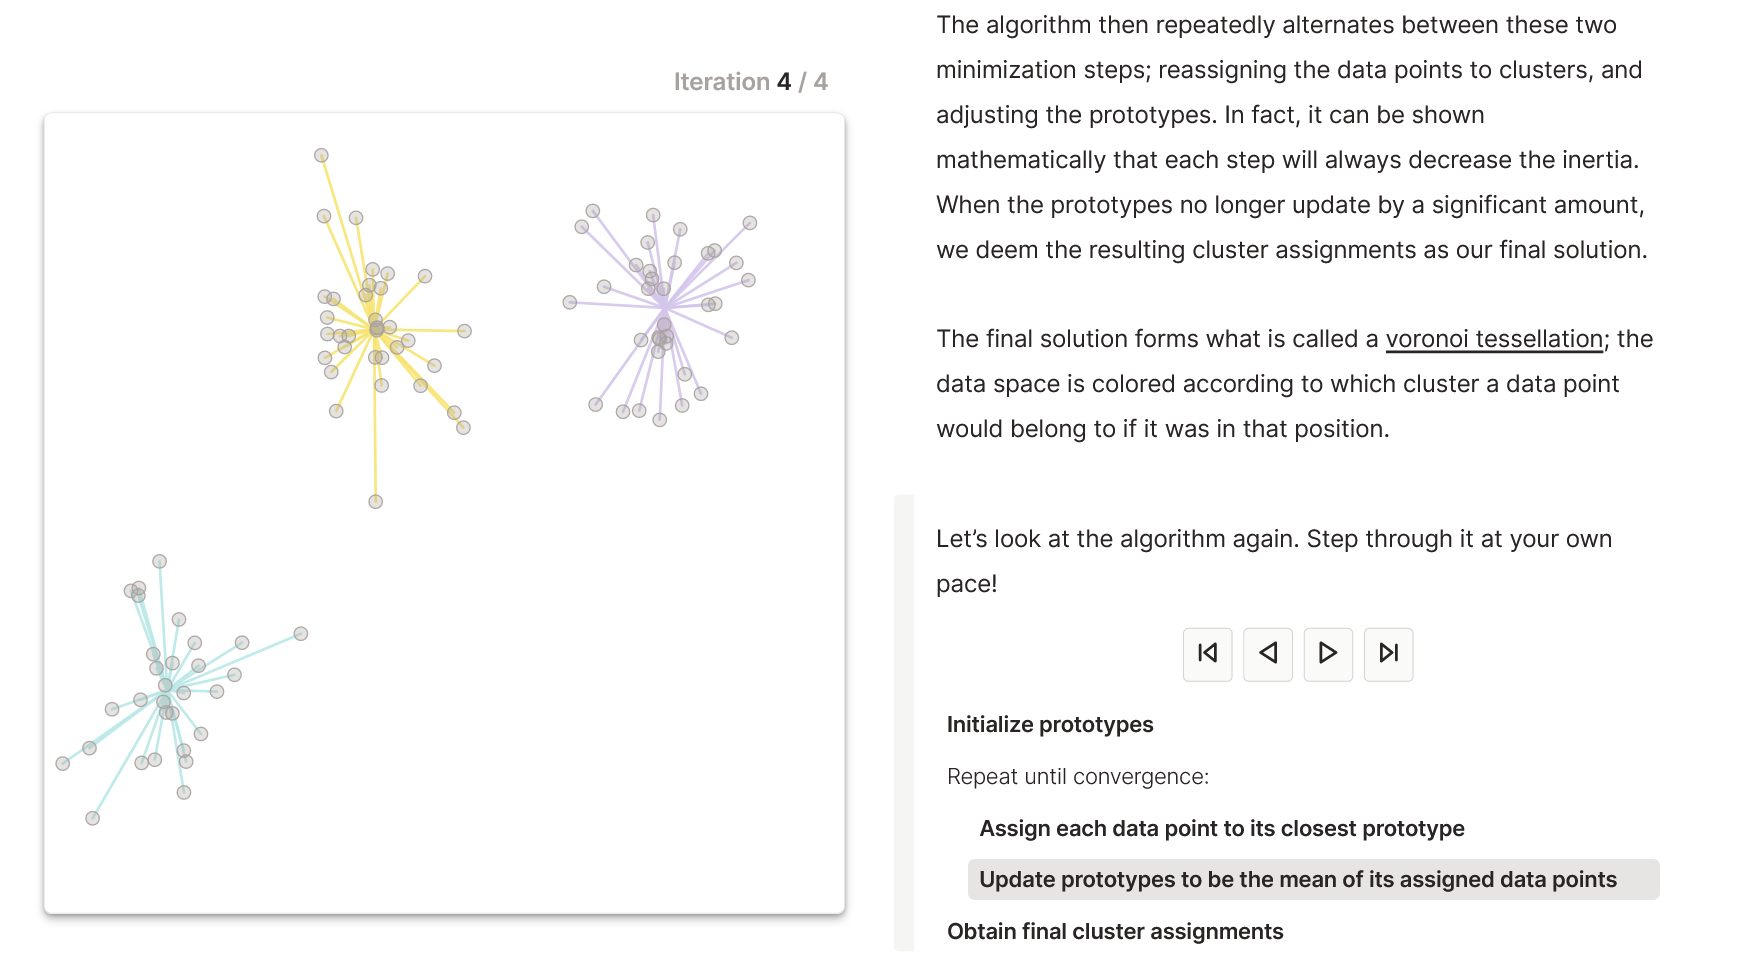
One way to perform clustering efficiently is the so-called K-Means algorithm. Here, the data can be classified into a certain amount of selected groups, the number of which is determined in advance – the so-called clusters. The K-Means algorithm is based on the fact that it attempts to reduce the distance between data features and a specified center point in the respective cluster until the correct group has been determined for each individual data point (Yu et al., 2020).
Explorable Explanation Designs: An Invitation to Dive into a Concept by Yourself
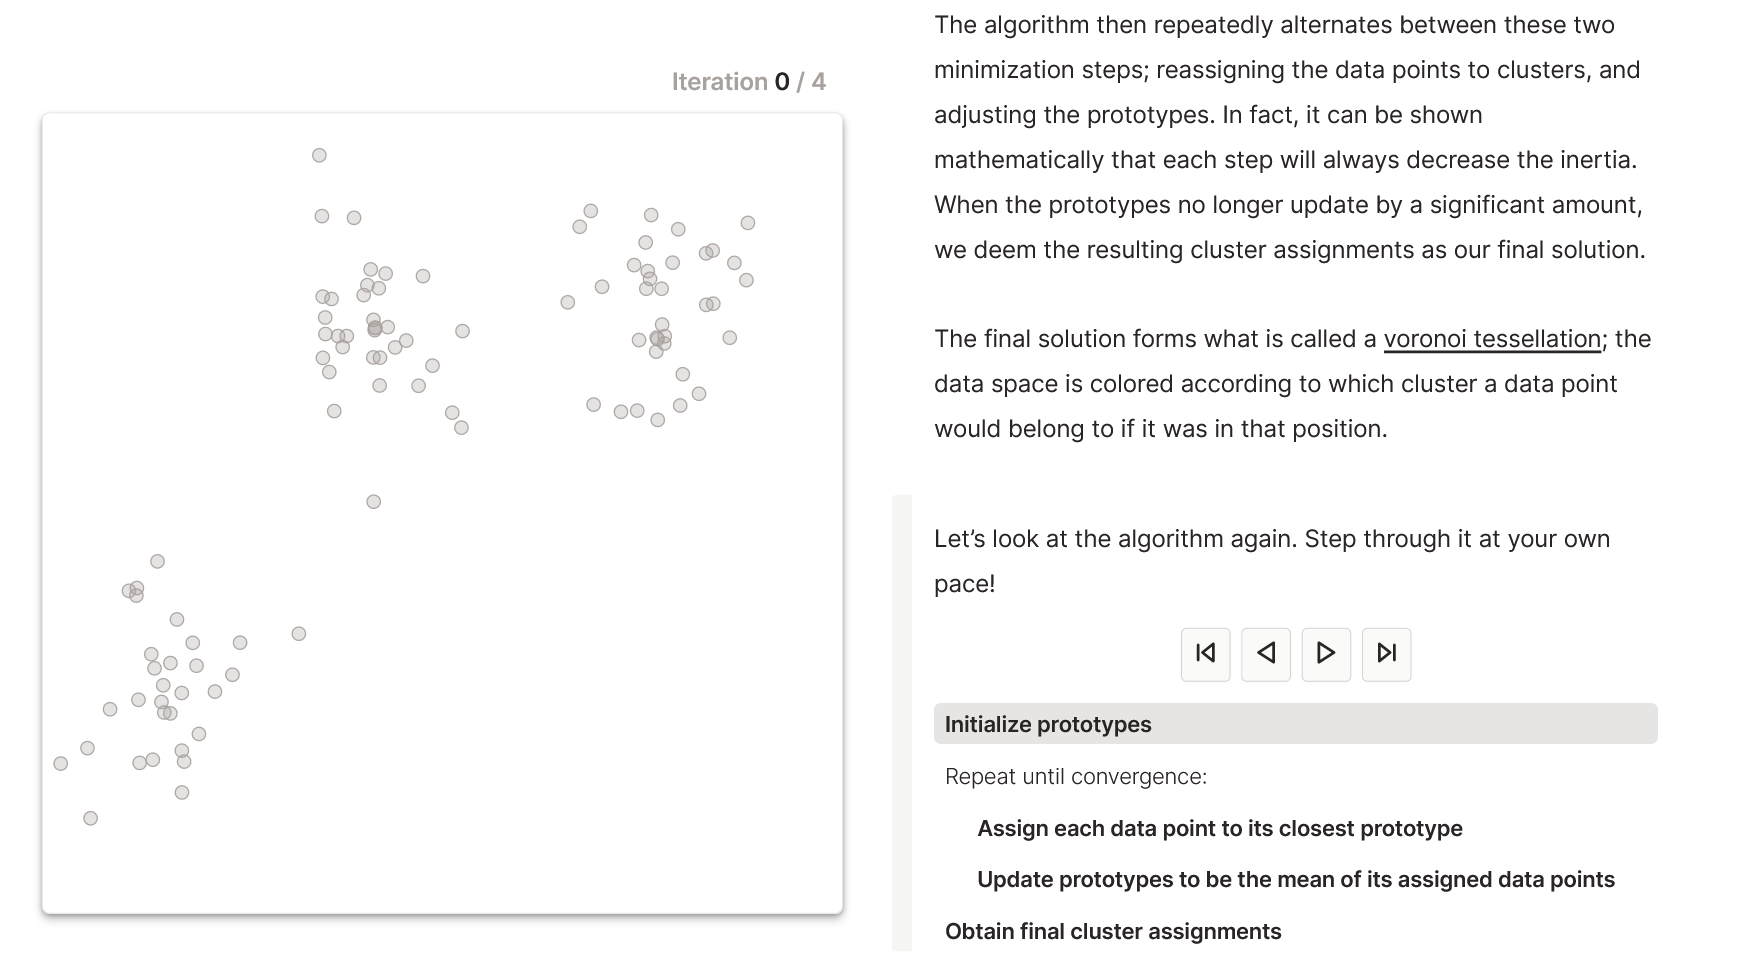
Explorable Explanation Designs are interactive and informative presentation formats of a chosen concept. The users explore the concept on their own by means of the underlying computer simulations. The goal of the designs is often to enable an active and playful way of acquiring information. In the example of the K-Means clustering algorithm, Yi Zhe Ang succeeds very impressively: through the immediate and spontaneous reactivity of the visualization to every mouse movement, the users are suddenly part of an interactive and even playful process. All the otherwise invisible computational steps of the K-Means algorithm are made visible by the visualization and, through this visibility, create a new kind of understanding.
Discovering and understanding complex content in an interactive way
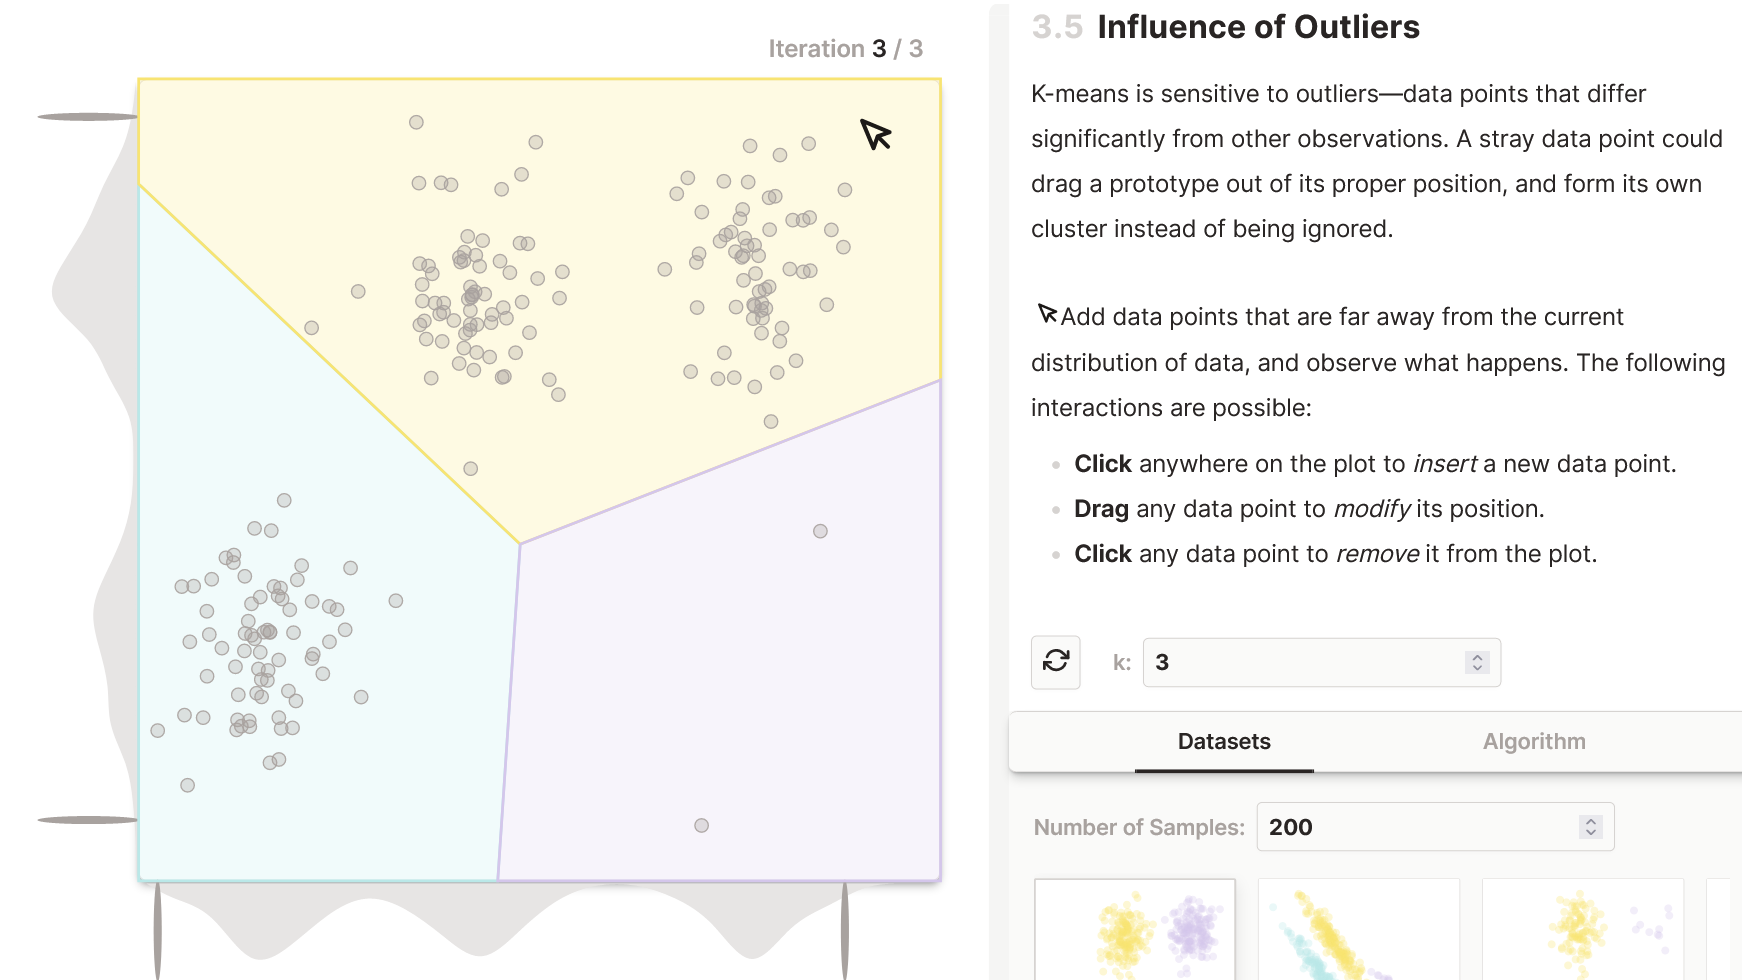
For learners in particular, this design format of the Explorable Explainer seems most valuable. Since the algorithm changes in front of our eyes through the scrolling movement as well as the user’s own input, it turns us into the explorers ourselves. The Explainer can progress and compute, but it can also go back and illustrate again what may have raised questions before. In the case of the clustering process with K-Means, for example, this can be seen in the influence of so-called outliers: outliers are data points that differ significantly from the rest of the collected observations. It is known from theory that the K-Means algorithm is very vulnerable to the influence of outliers. If they are not taken into account, they can form their own clusters at once (Yu et al., 2020). However, the latter is statistically undesirable and, as a result, can lead to faulty results.
Although the influence of outliers is well supported theoretically, the actual impact of outliers is not very tangible at first. It seems abstract to imagine how large or small the impact of such a data point can be on the clustering process. However, within the K-Means Explorable Explainer, this is exactly what is made possible. Users can position outliers themselves and observe how the distribution of clusters changes depending on how much the individual data point differs from the other observations. Statistical abstractness thus comes to life before our own eyes and is transformed into explorable and thus comprehensible concreteness.
Skilful interplay of language and design
The written explanations alongside the visualization complement the informational character of the design. They echo the gentle playfulness in the language style established by the pastel colors with a humorous, yet clearly comprehensible tone. The possibly otherwise intrusive request to be mathematically understood that the algorithm may evoke in learners is transformed by the colorful design and the easy-to-use interface into a gentle invitation to independently explore the world of the K-Means algorithm.
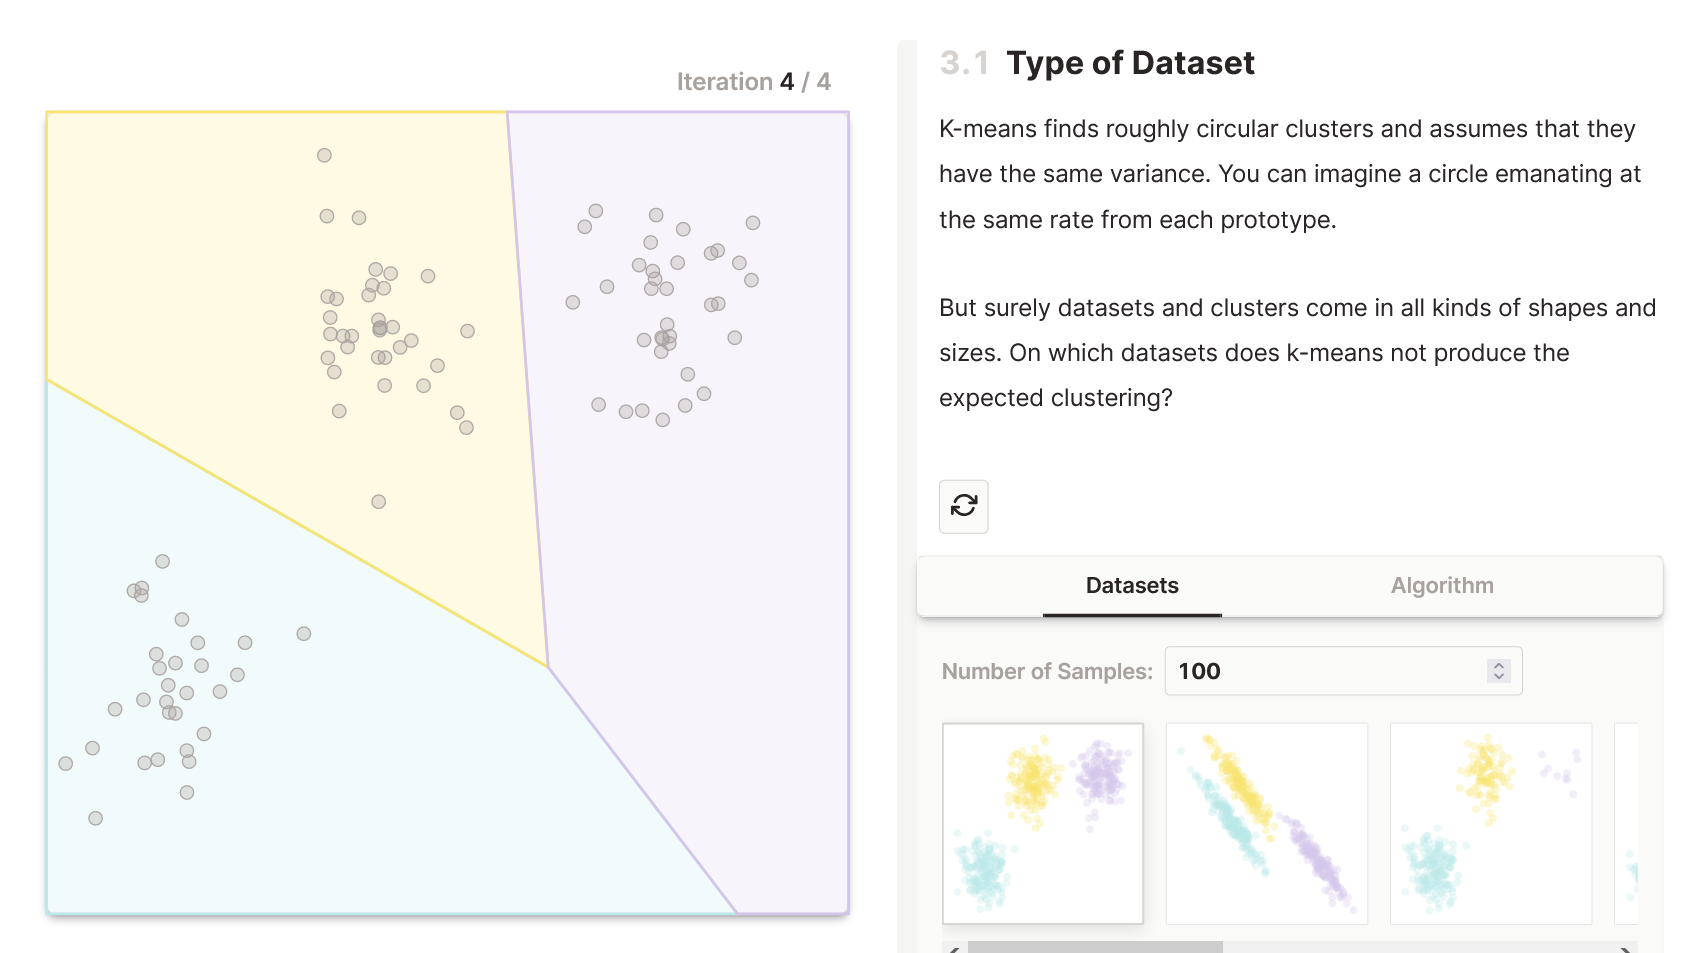
Individual settings consoder user preferences
In addition, Yi Zhe Ang allows us to explore the world of the K-Means algorithm entirely tailored to our own preferences. The manually adjustable small-step pace or the possibility of a quick run-through of the interactive visualization depends entirely on the user’s desire for information and the desired speed. From the perspective of science communication research, Yi Zhe Ang impressively creates a user-centered format. It takes individual needs into consideration and responds to them.
Accordingly, it is not surprising that Yi Zhe Ang’s 2022 work won an Information is Beautiful Award in Silver as well as The Pudding Cup ’22. At VISxAI 2022, the Explorable Explainer was awarded in the Best Submission category.
Literature:
Yu, H., Wen, G., Gan, J., Zheng, W. & Lei, C. (2020). Self-paced learning for K-means clustering algorithm. Pattern Recognition Letters, 132, 69-75.
All images © Yi Zhe Ang
Click here to go directly to the Explorable Explainer
About the Visualization of the Month
In our series “Visualization of the Month”, we feature an outstanding visualization on the second Wednesday of each month. One of the criteria for the selection is the extent to which it is aesthetically and emotionally appealing from a design perspective. In addition, we look at the information content. This also includes how the users of the visualization are supported in better comprehending complex contexts. The selection is made within the KielSCN team and involves expertise from the fields of information design, educational science and emotion research, as well as science communication research.