VoM #8 – Dear Data
reviewed by Julia C. Ahrend
Storytelling with Data
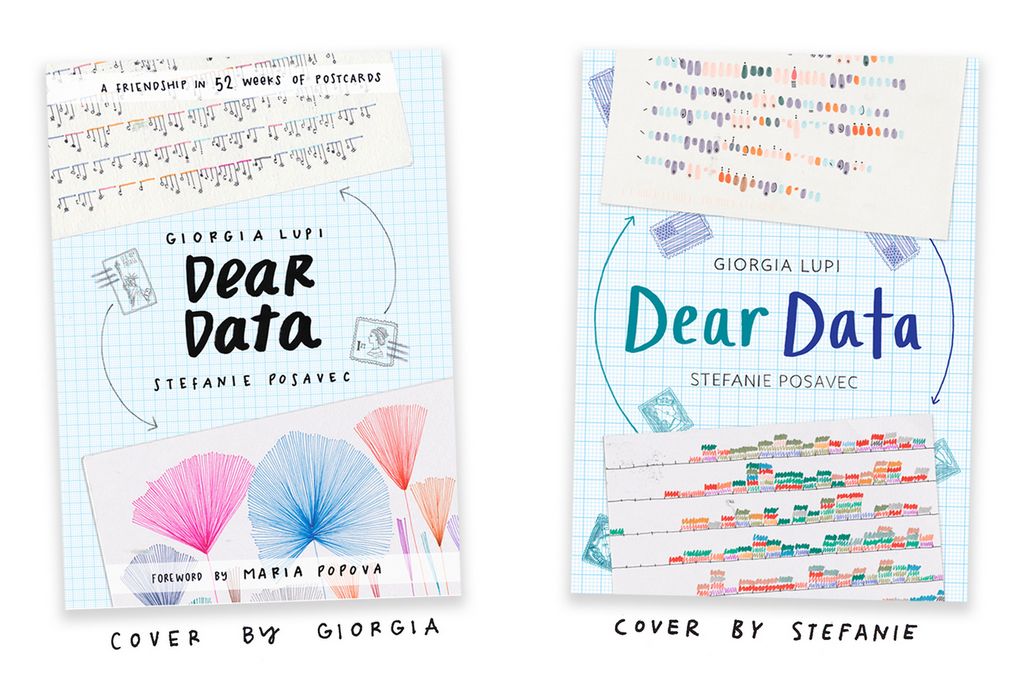
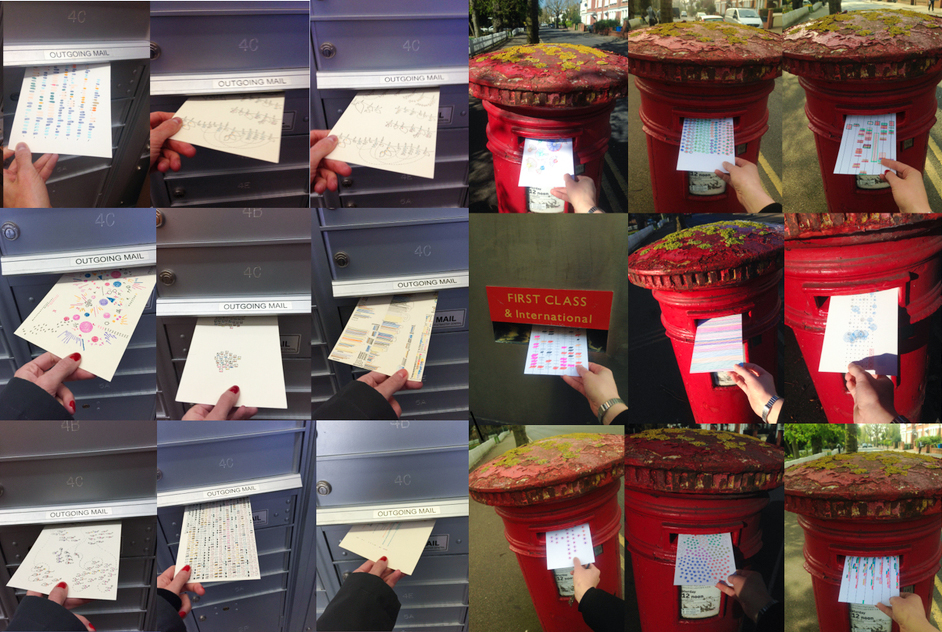
For the course of a year, information designer Giorgia Lupi and designer and artist Stefanie Posavec sent each other postcards with their personal data visualizations. For this purpose, they each collected data on a specific topic for one week. The result is the book “Dear Data”. As an example, for our visualization of the month #8 we have chosen a week that is all about goodbyes.
One Topic – Two Different Visualizations
To visualize the topic, Giorgia Lupi and Stefanie Posavec each recorded how often they said goodbye to whom and in exactly which manner. This resulted in two individual visuals. But how do they differ? What do they have in common? And what can we learn from them for science communication?
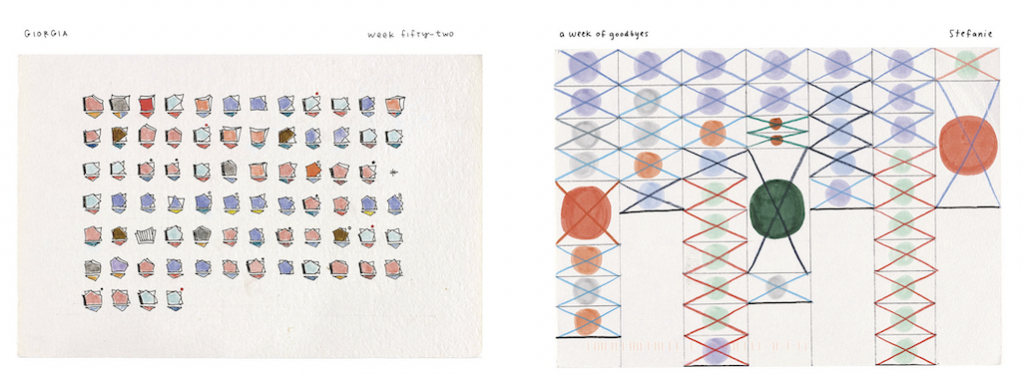
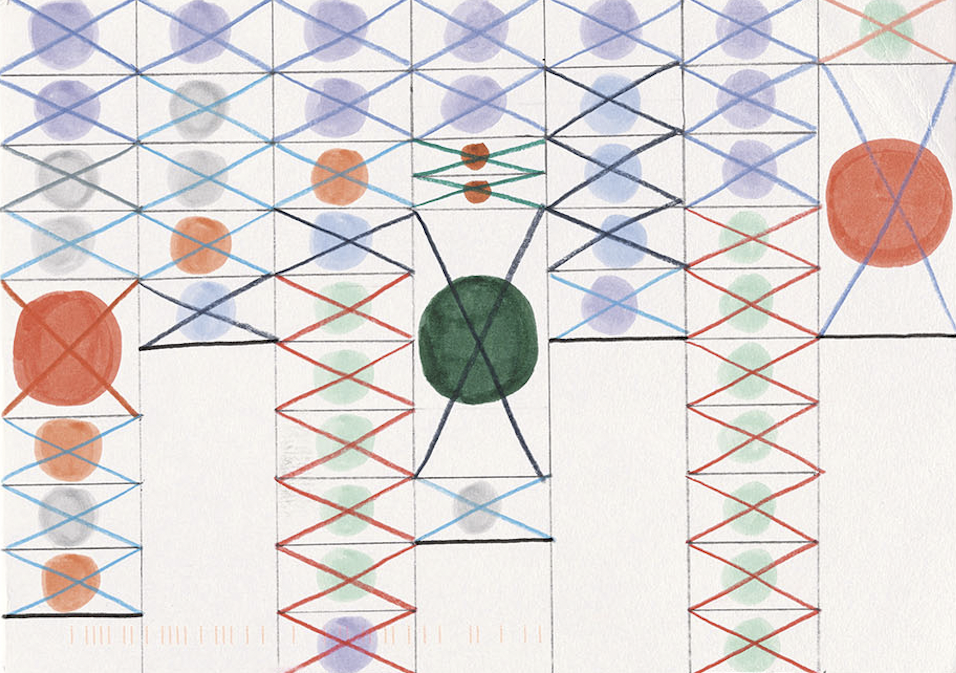
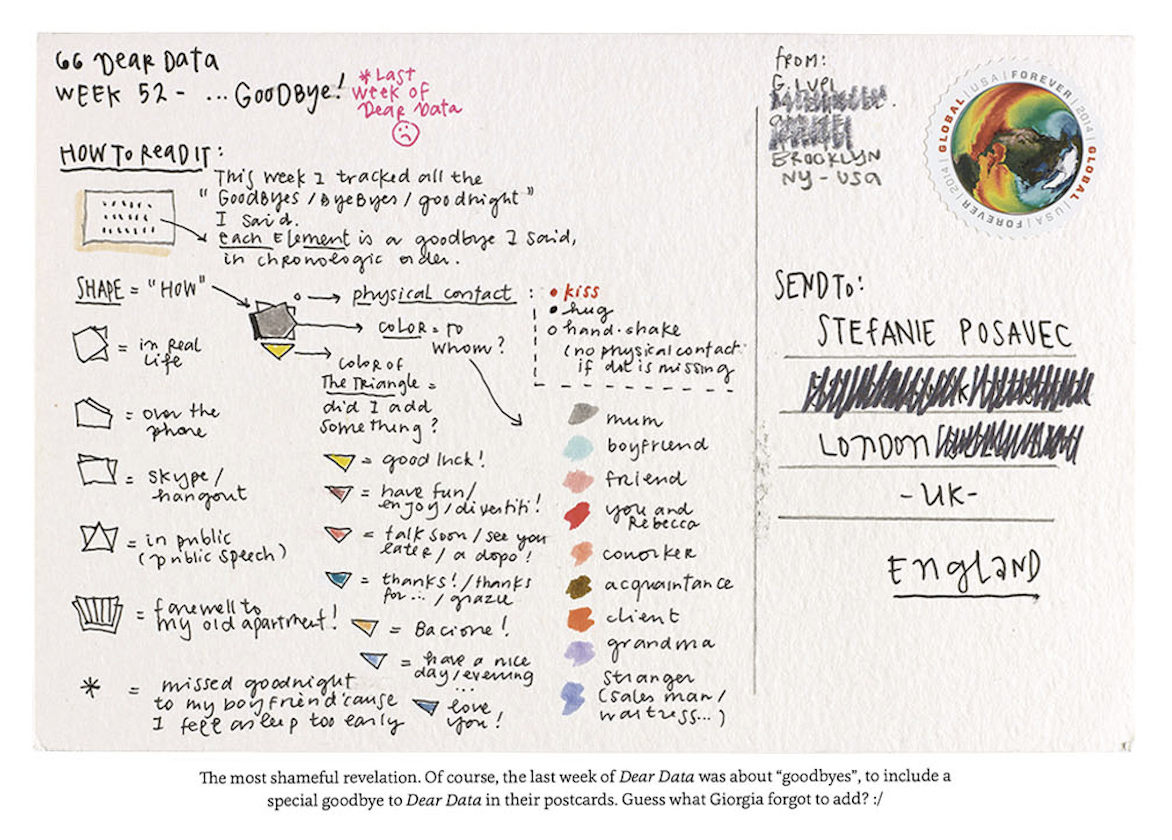
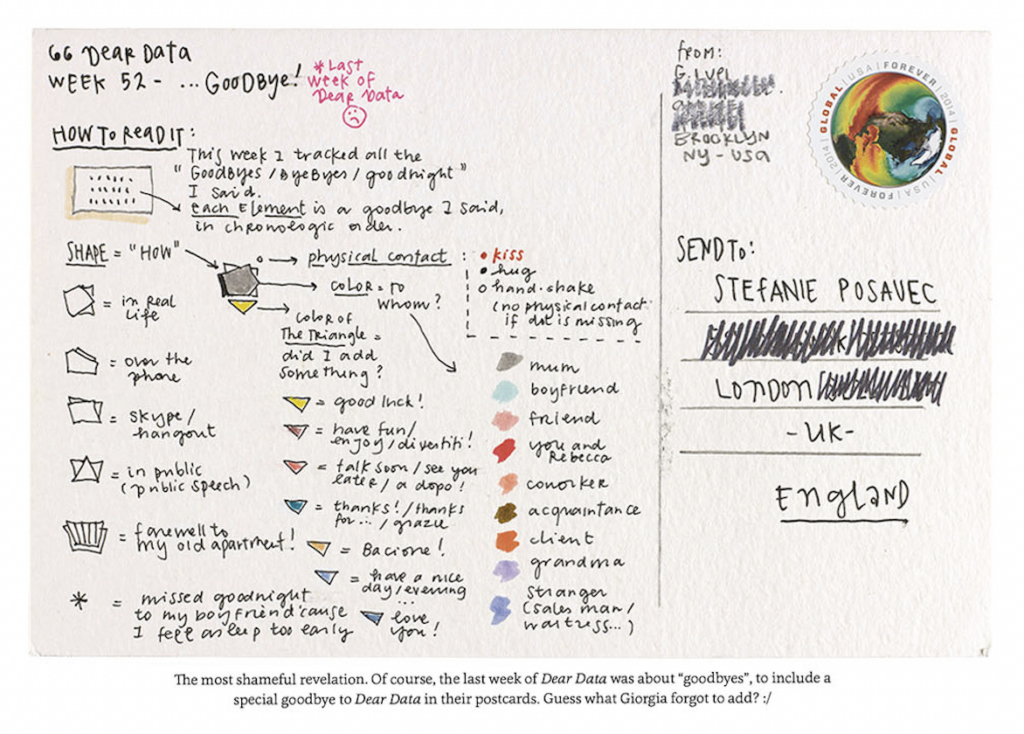
The colors of the main glyph, circle or polygon, each represent different people. The colors of the additional glyphs, cross or triangle under the polygon, provide information about the context of the enactment. Giorgia Lupi (left) has also added a layer of information to the shape of the polygon glyph, and at this point provides information about the “Where did the goodbye take place?”
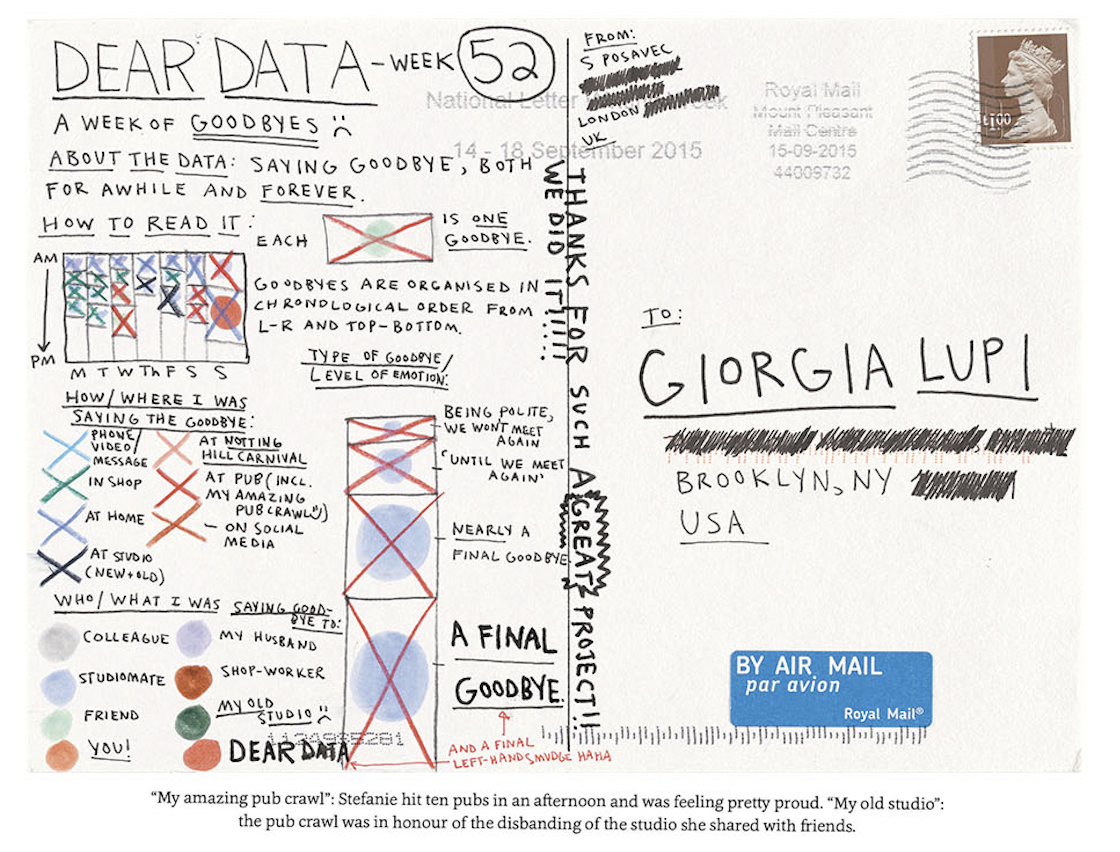
Stefanie Posavec’s visual (right) offers the eye different entry points through the three contrasting larger circles. For example, it represents that she has said goodbye to her old studio. Here, the size of the dark green circle signifies that it was a final goodbye. You can also tell by the column that holds the circle that the goodbye was on that weeks Thursday. It also lists who she said goodbye to and where. From this, one can see what she experienced during the week. So she is telling a story via the visualization of the data, even if it takes some decoding to read it.
The Potential of Abstract Graphics
Abstract illustrations hold the potential to convey moods and feelings – something for which bar charts are much less known. Ornamentation and decoration, on the other hand, are credited in design – despite controversy – with the ability to “evoke a certain kind of pleasure.” Good decoration is that which successfully frames a message, i.e. supports its communication. (cf. Heller & Vienne, 2019). Abstract graphics, in turn, serve the purpose of evoking images in us that support our imagination (cf. Heller & Vienne, 2019). In terms of design, the abstractness of both graphics makes use of the principles of ornamentation to unfold their effect.
Visual Code – Decoding a Secret Language
The form of this data visualization is not that of an already known type of diagram, but that of a visual code. As in a secret language, each glyph, for example a circle or triangle, is assigned a meaning. Together with the legend, it can then be deciphered what data is being transferred here in visual code. However, the legend is shifted to the back so that it is not directly visible. Reinforced by the fact that neither axis labels nor headings or subtitles are attached, the graphics are thus initially unreadable for us. They deny themselves to the recipient. Following the pioneer of data visualization Edward Tufte, the user is not given sufficient possibilities of understanding:
“Graphical Exellence is that what gives to the viewer the greatest number of ideas in the shortest time with the least ink in the smallest space.” (Tufte, 2001, S.51)
Thus, according to Tufte, the two graphics do not conform to the principle of “graphic excellence” on this point. However, he developed his principles against the background of graphics that want to communicate clearly and quickly with the public. This does not correspond to the concept that Giorgia Lupi and Stefanie Posavec have taken as a starting point here: They want to explicitly explore visual potentials, experiment with new methods of representation, and get to know each other through data stories. The scale of Tufte’s excellence criteria does not do justice to this project, and so there is a need for criteria of value that do more justice to the purposes pursued here.
From Excellence to Expressiveness
For the space creatively developed in the Dear Data project, Jo Wood uses the term “expressiveness.” In the visual essay “Beyond the Walled Garden” he points out the interplay of expressiveness towards effectiveness in communication (in relation to the understanding of the users) in information graphics. An example supporting Wood’s theory is hence found here: high visual expressivity and decodability are difficult to achieve at the same time. Further, he presents the visual arts as a testing ground for this expressivity and its emotional mediation potential. What Giorgia Lupi and Stefanie Posavec do with their graphics is a visual exploration of what lies beyond traditional information-graphic formal languages – their expressiveness.
Expressivity Through Color and Contrasts
But how exactly is this expressivity demonstrated? Color is an indicator of the expressiveness of a visual product. Both graphics use a pastel color palette. This creates a calm mood in both.


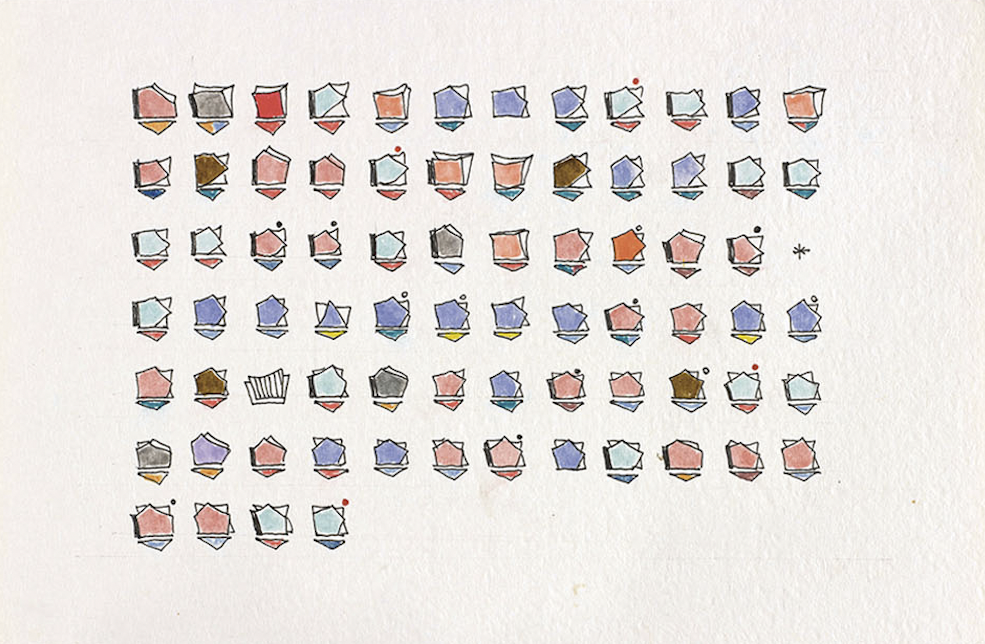
Giorgia Lupi’s graphic also appears more homogeneous and uniform. This is partly due to the generous use of white space and the fact that she has not scaled the glyphs differently, as Stefanie Posavec has. When scanned by the eye, the individual elements do not seem particularly different. The greatest color contrast is found in the light-dark distribution from the background to the brown colored glyphs. However, since these are also distributed in a balanced way on the paper, they also support the regular, calm effect. Even the two elements of the star and the uncolored glyph hardly break this monotonous rhythm.
In contrast, Stefanie Posavec’s visualization is richer in contrast, which is mainly due to the shape contrast of the three large circles. The color contrast in these three glyphs further reinforces this. It gives the graphic a more restless but also more dynamic look. From an aesthetic perspective, the color effects are initially similar, but the composition of the elements on the paper provides different dynamics.
Complementing the color, the execution of the graphics has an expressive effect. This is clearly handmade and the technique thus refers to the human being as the creator. Giorgia Lupi herself coins the term data humanism. Here, however, she is not only aiming at the production technique, but also at the awareness of the blurriness in each data set.
Straight lines and exact circles lead us to believe that the underlying data are just as exact. But most data collection, documentation, evaluation, and even visualization processes have fuzziness. According to Lupi, a manual ductus makes the world of data more human again. She also believes that sketching with data – that is, what she is doing in the project presented here – has the potential to test new forms of representation. In this way, new terrain of visualization can be entered not only in the sense of expressivity, but also in the sense of a data humanism, precisely by dealing with its data manually.
Data Humanism for Science Communication
There is another functionality in the Dear Data visualizations: that of expressivity and the data humanims expressed through it. Certainly, the perception of this expressivity varies greatly depending on the context. A person who has the entire Dear Data book in print in front of her or him perceives the visualizations differently than a person who sees only a few excerpts. Also, different groups of the population perceive the graphics differently.
Against the backdrop of science communication, in which ambiguous relationships and constantly changing processes are often communicated, Giorgia Lupi’s humanistic approach is a way of doing graphic justice to uncertainties. If the formal-aesthetic nature of the graphic manages, through its expressivity, to invite the viewer to decode, to make them curious, or simply to attract their attention, then one goal of science communication has already been achieved.
Sources/Literature:
Heller, S., & Vienne, V. (2019). 100 Ideas that Changed Graphic Design. Laurence King Publishing.
Data Humanism, the Revolution will be Visualized.
Wood, J. (2022). Beyond the walled garden: A visual essay in five chapters.
All images © Giorgia Lupi/Stefanie Posavec
About the Visualization of the Month
In our series “Visualization of the Month”, we feature an outstanding visualization on the second Wednesday of each month. One of the criteria for the selection is the extent to which it is aesthetically and emotionally appealing from a design perspective. In addition, we look at the information content. This also includes how the users of the visualization are supported in better comprehending complex contexts. The selection is made within the KielSCN team and involves expertise from the fields of information design, educational science and emotion research, as well as science communication research.